ComEd 2003 Annual Report Download - page 58
Download and view the complete annual report
Please find page 58 of the 2003 ComEd annual report below. You can navigate through the pages in the report by either clicking on the pages listed below, or by using the keyword search tool below to find specific information within the annual report.-
 1
1 -
2
-
3
-
4
-
5
-
6
-
7
-
8
-
9
-
10
-
11
-
12
-
13
-
14
-
15
-
16
-
17
-
18
-
19
-
20
-
21
-
22
-
23
-
24
-
25
-
26
-
27
-
28
-
29
-
30
-
31
-
32
-
33
-
34
-
35
-
36
-
37
-
38
-
39
-
40
-
41
-
42
-
43
-
44
-
45
-
46
-
47
-
 48
48 -
 49
49 -
 50
50 -
 51
51 -
 52
52 -
 53
53 -
 54
54 -
 55
55 -
 56
56 -
 57
57 -
 58
58 -
 59
59 -
 60
60 -
 61
61 -
 62
62 -
 63
63 -
 64
64 -
 65
65 -
 66
66 -
 67
67 -
 68
68 -
69
-
70
-
71
-
72
-
73
-
74
-
75
-
76
-
77
-
78
-
79
-
80
-
81
-
82
-
83
-
84
-
85
-
86
-
87
-
88
-
89
-
90
-
91
-
92
-
93
-
94
-
95
-
96
-
97
-
98
-
99
-
100
-
101
-
102
-
103
-
104
-
105
-
106
-
107
-
108
-
109
-
110
-
111
-
112
-
113
-
114
-
115
-
116
-
117
-
118
-
119
-
120
-
121
-
122
-
123
-
124
-
125
-
126
-
127
-
128
-
129
-
130
-
131
-
132
-
133
-
134
-
135
-
136
-
137
-
138
 |
 |

56 Management’s Discussion and Analysis of Financial Condition and Results of Operations
EXELON CORPORATION AND SUBSIDIARY COMPANIES
We are in the process of implementing its new business
model referred to as The Exelon Way. This business model is
focused on improving operating cash flows while meeting
service and financial commitments through integration
of operations and consolidation of support functions.
We have targeted approximately $300 million of annual
cash savings beginning in 2004 and increasing the annual
cash savings to $600 million in 2006.
As part of the implementation of The Exelon Way, we
identified approximately 1,500 positions for elimination by
the end of 2004 and recorded a charge for salary con-
tinuance severance of $130 million before income taxes dur-
ing 2003, which we anticipate that the majority will be paid
in 2004 and 2005. We are considering whether there are
additional positions to be eliminated in 2005 and 2006. We
may incur further severance costs associated with The Ex-
elon Way if additional positions are identified to be elimi-
nated. These costs will be recorded in the period in which the
costs can be reasonably estimated.
Cash Flows from Operating Activities
Energy Delivery’s cash flows from operating activities primar-
ily result from sales of electricity and gas to a stable and
diverse base of retail customers at fixed prices and are
weighted toward the third quarter. Energy Delivery’s future
cash flows will depend upon the ability to achieve cost sav-
ings in operations and the impact of the economy, weather,
customer choice and future regulatory proceedings on its
revenues. Generation’s cash flows from operating activities
primarily result from the sale of electric energy to wholesale
customers, including Energy Delivery and Enterprises. Gen-
eration’s future cash flows from operating activities will
depend upon future demand and market prices for energy
and the ability to continue to produce and supply power at
competitive costs.
Cash flows from operations have been and are expected
to continue to provide a reliable, steady source of cash flow,
sufficient to meet operating and capital expenditures re-
quirements for the foreseeable future. Operating cash flows
after 2006 could be negatively affected by changes in the
rate regulatory environments of ComEd and PECO, although
any effects are not expected to hinder our ability to fund our
business requirements. See Business Outlook and the Chal-
lenges in Managing our Business for further information
regarding the regulatory transition periods.
Cash flows provided by operations in 2003 and 2002
were $3.4 billion and $3.6 billion, respectively. Changes in our
cash flows provided by operations are generally consistent
with changes in our results of operations, and further ad-
justed by changes in working capital in the normal course of
business.
In addition to the items mentioned in Results of Oper-
ations, the following items affected our operating cash flows
in 2003 and 2002:
– Purchases of natural gas at higher prices as well as slightly
increased volumes during 2003 resulted in an increase in
natural gas inventories of $54 million at Generation and
PECO and an increase in deferred natural gas costs of $50
million at PECO, resulting in a reduction to operating cash
flows of $104 million. During 2002, changes in deferred
natural gas costs of $25 million and a decrease in natural
gas inventories during the year of $37 million, resulted in a
$62 million increase in operating cash flows.
– Discretionary tax-deductible pension plan payments of
$367 million in 2003 compared to $202 million in 2002.
Additionally, we contributed $134 million and $73 million
to the postretirement welfare benefit plans in 2003 and
2002, respectively.
We expect to contribute up to approximately $419 million to
our pension plans in 2004. These contributions exclude
benefit payments expected to be made directly from corpo-
rate assets. Of the $419 million expected to be contributed to
the pension plans during 2004, $17 million is estimated to be
needed to satisfy IRS minimum funding requirements.
Cash Flows from Investing Activities
Cash flows used in investing activities in 2003 and 2002
were $2.1 billion and $2.6 billion, respectively. Cash used in
investing activities decreased from 2002 due to lower capital
expenditures of $288 million, net of liquidated damages re-
ceived during 2003 of $92 million, a reduction in cash used
to acquire businesses of $173 million, a net increase over
2002 in amounts contributed into the nuclear decom-
missioning trust funds of $11 million and a decrease from
2002 in the proceeds from the sale of businesses in the cur-
rent year of $24 million.
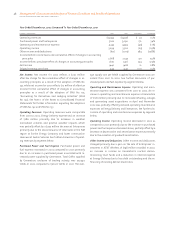
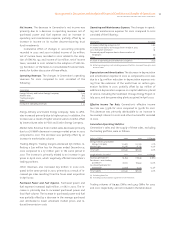
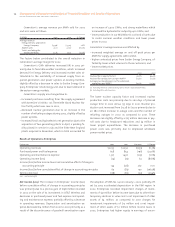
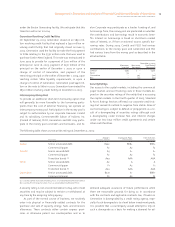
Capital expenditures by business segment for 2003 and
projected amounts for 2004 are as follows:
2003 2004
Energy Delivery $ 962 $ 855
Generation 953 972
Enterprises 14 1
Corporate and other 25 35
Total capital expenditures 1,954 1,863
Acquisition of businesses, net of cash
acquired 272 –
Total capital expenditures and acquisition of
businesses $2,226 $1,863