ComEd 2003 Annual Report Download - page 73
Download and view the complete annual report
Please find page 73 of the 2003 ComEd annual report below. You can navigate through the pages in the report by either clicking on the pages listed below, or by using the keyword search tool below to find specific information within the annual report.-
 1
1 -
2
-
3
-
4
-
5
-
6
-
7
-
8
-
9
-
10
-
11
-
12
-
13
-
14
-
15
-
16
-
17
-
18
-
19
-
20
-
21
-
22
-
23
-
24
-
25
-
26
-
27
-
28
-
29
-
30
-
31
-
32
-
33
-
34
-
35
-
36
-
37
-
38
-
39
-
40
-
41
-
42
-
43
-
44
-
45
-
46
-
47
-
48
-
49
-
50
-
51
-
52
-
53
-
54
-
55
-
56
-
57
-
58
-
59
-
60
-
61
-
62
-
 63
63 -
 64
64 -
 65
65 -
 66
66 -
 67
67 -
 68
68 -
 69
69 -
 70
70 -
 71
71 -
 72
72 -
 73
73 -
 74
74 -
 75
75 -
 76
76 -
 77
77 -
 78
78 -
 79
79 -
 80
80 -
 81
81 -
 82
82 -
 83
83 -
84
-
85
-
86
-
87
-
88
-
89
-
90
-
91
-
92
-
93
-
94
-
95
-
96
-
97
-
98
-
99
-
100
-
101
-
102
-
103
-
104
-
105
-
106
-
107
-
108
-
109
-
110
-
111
-
112
-
113
-
114
-
115
-
116
-
117
-
118
-
119
-
120
-
121
-
122
-
123
-
124
-
125
-
126
-
127
-
128
-
129
-
130
-
131
-
132
-
133
-
134
-
135
-
136
-
137
-
138
 |
 |

71Management’s Discussion and Analysis of Financial Condition and Results of Operations
EXELON CORPORATION AND SUBSIDIARY COMPANIES
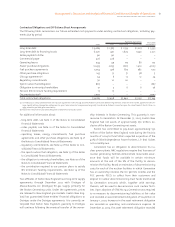
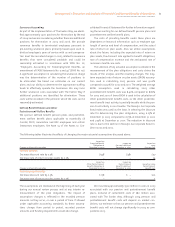
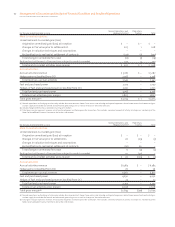
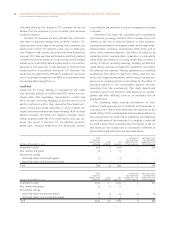
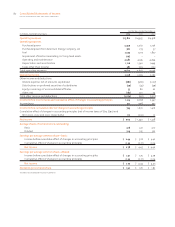
The following table provides detail on changes in Generation’s mark-to-market net asset or liability balance sheet position
from January 1, 2002 to December 31, 2003. It indicates the drivers behind changes in the balance sheet amounts. This table
incorporates the mark-to-market activities that are immediately recorded in earnings, as shown in the previous table, as well
as the settlements from OCI to earnings and changes in fair value for the hedging activities that are recorded in Accumulated
Other Comprehensive Income on the Consolidated Balance Sheets.
Normal Operations and
Hedging Activities
Proprietary
Trading Total
Total mark-to-market energy contract net assets at January 1, 2002 $ 78 $ 14 $ 92
Total change in fair value during 2002 of contracts recorded in earnings 26 (29) (3)
Reclassification to realized at settlement of contracts recorded in earnings (20) 20 –
Reclassification to realized at settlement from OCI (53) – (53)
Effective portion of changes in fair value–recorded in OCI (210) – (210)
Purchase/sale of existing contracts or portfolios subject to mark-to-market 11 – 11
Total mark-to-market energy contract net assets (liabilities) at December 31, 2002 (168) 5 (163)
Total change in fair value during 2003 of contracts recorded in earnings 206 – 206
Reclassification to realized at settlement of contracts recorded in earnings (223) (4) (227)
Reclassification to realized at settlement from OCI 273 – 273
Effective portion of changes in fair value–recorded in OCI (305) – (305)
Total mark-to-market energy contract net assets (liabilities) at December 31, 2003 $ (217) $ 1 $ (216)
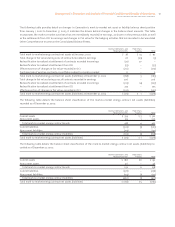
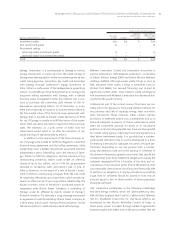
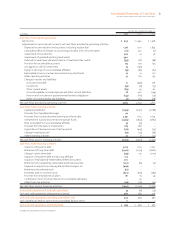
The following table details the balance sheet classification of the mark-to-market energy contract net assets (liabilities)
recorded as of December 31, 2003:
Normal Operations and
Hedging Activities
Proprietary
Trading Total
Current assets $ 319 $ 3 $ 322
Noncurrent assets 99 1 100
Total mark-to-market energy contract assets 418 4 422
Current liabilities (502) (3) (505)
Noncurrent liabilities (133) – (133)
Total mark-to-market energy contract liabilities (635) (3) (638)
Total mark-to-market energy contract net assets (liabilities) $ (217) $ 1 $ (216)
The following table details the balance sheet classification of the mark-to-market energy contract net assets (liabilities) re-
corded as of December 31, 2002:
Normal Operations and
Hedging Activities
Proprietary
Trading Total
Current assets $ 186 $6 $ 192
Noncurrent assets 46 – 46
Total mark-to-market energy contract assets 232 6 238
Current liabilities (276) – (276)
Noncurrent liabilities (124) (1) (125)
Total mark-to-market energy contract liabilities (400) (1) (401)
Total mark-to-market energy contract net assets (liabilities) $ (168) $ 5 $ (163)