ComEd 2003 Annual Report Download - page 72
Download and view the complete annual report
Please find page 72 of the 2003 ComEd annual report below. You can navigate through the pages in the report by either clicking on the pages listed below, or by using the keyword search tool below to find specific information within the annual report.-
 1
1 -
2
-
3
-
4
-
5
-
6
-
7
-
8
-
9
-
10
-
11
-
12
-
13
-
14
-
15
-
16
-
17
-
18
-
19
-
20
-
21
-
22
-
23
-
24
-
25
-
26
-
27
-
28
-
29
-
30
-
31
-
32
-
33
-
34
-
35
-
36
-
37
-
38
-
39
-
40
-
41
-
42
-
43
-
44
-
45
-
46
-
47
-
48
-
49
-
50
-
51
-
52
-
53
-
54
-
55
-
56
-
57
-
58
-
59
-
60
-
61
-
 62
62 -
 63
63 -
 64
64 -
 65
65 -
 66
66 -
 67
67 -
 68
68 -
 69
69 -
 70
70 -
 71
71 -
 72
72 -
 73
73 -
 74
74 -
 75
75 -
 76
76 -
 77
77 -
 78
78 -
 79
79 -
 80
80 -
 81
81 -
 82
82 -
83
-
84
-
85
-
86
-
87
-
88
-
89
-
90
-
91
-
92
-
93
-
94
-
95
-
96
-
97
-
98
-
99
-
100
-
101
-
102
-
103
-
104
-
105
-
106
-
107
-
108
-
109
-
110
-
111
-
112
-
113
-
114
-
115
-
116
-
117
-
118
-
119
-
120
-
121
-
122
-
123
-
124
-
125
-
126
-
127
-
128
-
129
-
130
-
131
-
132
-
133
-
134
-
135
-
136
-
137
-
138
 |
 |

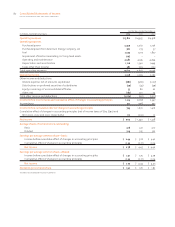
70 Management’s Discussion and Analysis of Financial Condition and Results of Operations
EXELON CORPORATION AND SUBSIDIARY COMPANIES
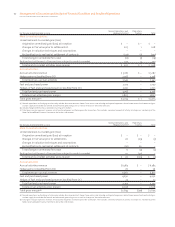
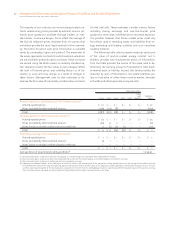
For the year ended December 31, 2003
Normal Operations and
Hedging Activities(a)
Proprietary
Trading Total
Mark-to-market activities:
Unrealized mark-to-market gain/(loss)
Origination unrealized gain/(loss) at inception $ – $ – $ –
Changes in fair value prior to settlements(b) 207 1 208
Changes in valuation techniques and assumptions – – –
Reclassification to realized at settlement of contracts (223) (4) (227)
Total change in unrealized fair value (16) (3) (19)
Realized net settlement of transactions subject to mark-to-market 223 4 227
Total mark-to-market activities gross margin $ 207 $ 1 $ 208
Accrual activities:
Accrual activities revenue $ 5,187 $ – $ 5,187
Hedge gains reclassified from OCI 2,358 – 2,358
Total revenue—accrual activities 7,545 – 7,545
Fuel and purchased power 2,107 – 2,107
Hedges of fuel and purchased power reclassified from OCI 2,631 – 2,631
Total fuel and purchased power 4,738 – 4,738
Total accrual activities gross margin 2,807 – 2,807
Total gross margin(c) $ 3,014 $ 1 $ 3,015
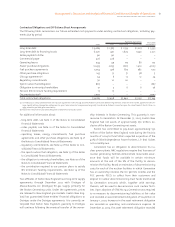
(a) Normal operations and hedging activities only include derivative contracts Power Team enters into to hedge anticipated exposures related to our owned and contracted gen-
eration supply, but excludes our owned and contracted generating assets as well as Enterprises’ derivative contracts.
(b) Includes hedge ineffectiveness, recorded in earnings of $1 million.
(c) Total gross margin represents revenue, net of purchased power and fuel expense for Generation. This excludes a minimal amount of activity at Enterprises. See Note 15 of the
Notes to Consolidated Financial Statements for further information.
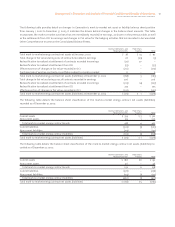
For the year ended December 31, 2002
Normal Operations and
Hedging Activities(a)
Proprietary
Trading Total
Mark-to-market activities:
Unrealized mark-to-market gain/(loss)
Origination unrealized gain/(loss) at inception $ – $ – $ –
Changes in fair value prior to settlements 26 (29) (3)
Changes in valuation techniques and assumptions – – –
Reclassification to realized at settlement of contracts (20) 20 –
Total change in unrealized fair value 6 (9) (3)
Realized net settlement of transactions subject to mark-to-market 20 (20) –
Total mark-to-market activities gross margin $ 26 $(29) $ (3)
Accrual activities:
Accrual activities revenue $ 6,785 $ – $ 6,785
Hedge gains reclassified from OCI 76 – 76
Total revenue—accrual activities 6,861 – 6,861
Fuel and purchased power 4,230 – 4,230
Hedges of fuel and purchased power reclassified from OCI 23 – 23
Total fuel and purchased power 4,253 – 4,253
Total accrual activities gross margin 2,608 – 2,608
Total gross margin(b) $ 2,634 $(29) $2,605
(a) Normal operations and hedging activities only include derivative contracts Power Team enters into to hedge anticipated exposures related to our owned and contracted gen-
eration supply, but excludes our owned and contracted generating assets as well as Enterprises’ derivative contracts.
(b) Total gross margin represents revenue, net of purchased power and fuel expense for Generation. This excludes a minimal amount of activity at Enterprises. See Note 15 of the
Notes to Consolidated Financial Statements for further information.