ComEd 2003 Annual Report Download - page 56
Download and view the complete annual report
Please find page 56 of the 2003 ComEd annual report below. You can navigate through the pages in the report by either clicking on the pages listed below, or by using the keyword search tool below to find specific information within the annual report.-
 1
1 -
2
-
3
-
4
-
5
-
6
-
7
-
8
-
9
-
10
-
11
-
12
-
13
-
14
-
15
-
16
-
17
-
18
-
19
-
20
-
21
-
22
-
23
-
24
-
25
-
26
-
27
-
28
-
29
-
30
-
31
-
32
-
33
-
34
-
35
-
36
-
37
-
38
-
39
-
40
-
41
-
42
-
43
-
44
-
45
-
 46
46 -
 47
47 -
 48
48 -
 49
49 -
 50
50 -
 51
51 -
 52
52 -
 53
53 -
 54
54 -
 55
55 -
 56
56 -
 57
57 -
 58
58 -
 59
59 -
 60
60 -
 61
61 -
 62
62 -
 63
63 -
 64
64 -
 65
65 -
 66
66 -
67
-
68
-
69
-
70
-
71
-
72
-
73
-
74
-
75
-
76
-
77
-
78
-
79
-
80
-
81
-
82
-
83
-
84
-
85
-
86
-
87
-
88
-
89
-
90
-
91
-
92
-
93
-
94
-
95
-
96
-
97
-
98
-
99
-
100
-
101
-
102
-
103
-
104
-
105
-
106
-
107
-
108
-
109
-
110
-
111
-
112
-
113
-
114
-
115
-
116
-
117
-
118
-
119
-
120
-
121
-
122
-
123
-
124
-
125
-
126
-
127
-
128
-
129
-
130
-
131
-
132
-
133
-
134
-
135
-
136
-
137
-
138
 |
 |

54 Management’s Discussion and Analysis of Financial Condition and Results of Operations
EXELON CORPORATION AND SUBSIDIARY COMPANIES
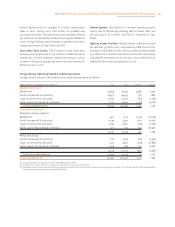
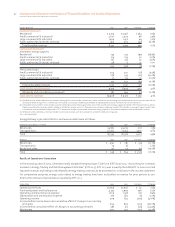
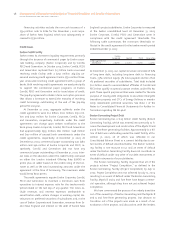
Generation’s average revenue per MWh sold for 2002
and 2001 were as follows:
($/MWh) 2002 2001 % Change
Average revenue
Energy Delivery and Exelon
Energy Company $33.98 $ 33.05 2.8%
Market sales 31.01 37.00 (16.2%)
Total—excluding the
trading portfolio 32.78 34.51 (5.0%)
The factors below contributed to the overall reduction in
Generation’s average margin for 2002.
Generation’s GWh deliveries increased 6% in 2002 pri-
marily due to favorable weather conditions, which increased
demand for Energy Delivery and increased market sales at-
tributable to the availability of increased supply from ac-
quired generation and power uprates at existing facilities,
slightly offset by a decrease in sales to Exelon Energy Com-
pany, Enterprises’ retail energy unit, due to lower demand in
the eastern energy markets.
Generation’s supply mix changed due to:
– increased purchases resulting from the supply agreement
with AmerGen’s Unit No. 1 at Three Mile Island Nuclear Sta-
tion facility which was new in 2002,
– decreased nuclear generation due to an increase in the
number of refueling outages during 2002, slightly offset by
power uprates,
– increased fossil and hydroelectric net generation due to the
acquisition of two generating plants in April, a peaking fa-
cility placed in service in July and the Sithe New England
plants acquired in November, which in total accounted for
an increase of 2,500 GWhs, and strong waterflows which
increased the hydroelectric output by 400 GWhs, and
– lower production in our Mid-Atlantic coal and oil units due
to cooler summer weather conditions and lower power
prices in 2002.
Generation’s average revenue was affected by:
– increased weighted average on and off peak prices per
MWh for supply agreements with ComEd,
– higher contracted prices from Exelon Energy Company, af-
fected by lower actual volumes to those customers, and
– lower market prices.
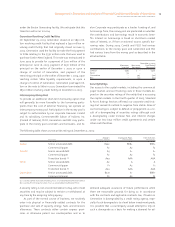
2002 2001
Nuclear fleet capacity factor(a) 92.7% 94.4%
Nuclear fleet production cost per MWh(a) $13.00 $12.78
Average purchased power cost for wholesale
operations per MWh(b) $41.85 $45.94
(a) Including AmerGen and excluding Salem, which is operated by PSE&G.
(b) Including PPAs with AmerGen.
The lower nuclear capacity factor and increased nuclear
production costs are primarily due to 260 days of planned
outage time in 2002 versus 153 days in 2001. Nuclear pro-
duction cost increased from $12.78 to $13.00 primarily due to
an $80 million increase in outage costs and the number of
refueling outages in 2002 as compared to 2001. These
decreases are slightly offset by a $25 million decrease in pay-
roll costs due to headcount reductions and $4 million in
lower project expenditures. The decrease in purchased
power costs was primarily due to depressed wholesale
power market prices.
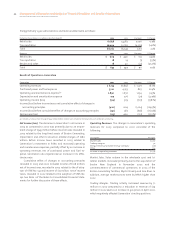
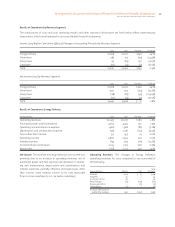
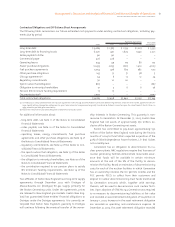
Results of Operations–Enterprises
Enterprises 2002 2001 Variance % Change
Operating revenues $2,033 $2,292 $(259) (11.3%)
Purchased power and fuel expense 658 854 (196) (23.0%)
Operating and maintenance expense 1,327 1,436 (109) (7.6%)
Operating income (loss) (14) (77) 63 (81.8%)
Income (loss) before income taxes and cumulative effect of change in
accounting principle 134 (128) 262 n.m.
Income (loss) before cumulative effect of change in accounting principles 65 (85) 150 (176.5%)
Net income (loss) (178) (85) (93) 109.4%
n.m. —not meaningful
Net Income (Loss). The increase in Enterprises’ income (loss)
before cumulative effect of change in accounting principles
was primarily due to a pre-tax gain of $198 million recorded
in 2002 on the sale of its investment in AT&T Wireless and
decreases in purchased power and fuel expense and operat-
ing and maintenance expense, partially offset by a decrease
in operating revenues. Depreciation and amortization ex-
pense decreased $14 million from 2001 to 2002 primarily as a
result of the discontinuance of goodwill amortization upon
the adoption of SFAS No. 142 on January 1, 2002, partially off-
set by 2002 accelerated depreciation in the PJM region. In
2002, Enterprises recorded impairment charges of invest-
ments of $41 million before income taxes due to other-than-
temporary declines in value and a net impairment of other
assets of $4 million, as compared to 2001 charges for
investment impairments of $13 million and a net impair-
ment of other assets of $2 million before income taxes. In
2002, Enterprises had higher equity in earnings of uncon-