ComEd 2003 Annual Report Download - page 52
Download and view the complete annual report
Please find page 52 of the 2003 ComEd annual report below. You can navigate through the pages in the report by either clicking on the pages listed below, or by using the keyword search tool below to find specific information within the annual report.-
 1
1 -
2
-
3
-
4
-
5
-
6
-
7
-
8
-
9
-
10
-
11
-
12
-
13
-
14
-
15
-
16
-
17
-
18
-
19
-
20
-
21
-
22
-
23
-
24
-
25
-
26
-
27
-
28
-
29
-
30
-
31
-
32
-
33
-
34
-
35
-
36
-
37
-
38
-
39
-
40
-
41
-
 42
42 -
 43
43 -
 44
44 -
 45
45 -
 46
46 -
 47
47 -
 48
48 -
 49
49 -
 50
50 -
 51
51 -
 52
52 -
 53
53 -
 54
54 -
 55
55 -
 56
56 -
 57
57 -
 58
58 -
 59
59 -
 60
60 -
 61
61 -
 62
62 -
63
-
64
-
65
-
66
-
67
-
68
-
69
-
70
-
71
-
72
-
73
-
74
-
75
-
76
-
77
-
78
-
79
-
80
-
81
-
82
-
83
-
84
-
85
-
86
-
87
-
88
-
89
-
90
-
91
-
92
-
93
-
94
-
95
-
96
-
97
-
98
-
99
-
100
-
101
-
102
-
103
-
104
-
105
-
106
-
107
-
108
-
109
-
110
-
111
-
112
-
113
-
114
-
115
-
116
-
117
-
118
-
119
-
120
-
121
-
122
-
123
-
124
-
125
-
126
-
127
-
128
-
129
-
130
-
131
-
132
-
133
-
134
-
135
-
136
-
137
-
138
 |
 |

50 Management’s Discussion and Analysis of Financial Condition and Results of Operations
EXELON CORPORATION AND SUBSIDIARY COMPANIES
Volume. Energy Delivery’s electric revenues increased as a
result of increases, exclusive of weather impacts, in the
number of customers and additional average usage per cus-
tomer, primarily in the residential customer class.
Exclusive of weather impacts, higher delivery volume in-
creased gas revenue. Total deliveries to customers increased
5% in 2002 compared to 2001, primarily as a result of
customer growth and higher transportation volumes.
Weather. Energy Delivery’s electric revenues experienced
favorable weather impacts, primarily as a result of warmer
than usual summer weather. Cooling degree-days in the
ComEd and PECO service territories were 29% higher and 15%
higher in 2002 as compared to 2001, respectively. Heating
degree-days in the ComEd and PECO service territories were
3% higher and 1% higher, respectively, in 2002 compared
to 2001.
Customer Choice. Energy Delivery’s electric revenues in-
creased from 2001 to 2002 as a result of customer choice ac-
tivity. The increase includes increased revenues of $226
million from customers in Pennsylvania who selected or re-
turned to PECO as their energy supplier. The increase was
partially offset by a decrease in revenues of $131 million from
ComEd’s customers electing to purchase energy from alter-
native energy suppliers or electing ComEd’s PPO.
Rate Changes. The decrease in electric revenues attributable
to rate changes reflect $99 million for the 5% ComEd resi-
dential rate reduction, effective October 1, 2001, required by
the Illinois restructuring legislation and the timing of a $60
million PECO rate reduction in effect for 2001 and 2002,
partially offset by $50 million related to an increase in PECO’s
gross receipts tax effective January 1, 2002 and the expira-
tion of a 6% reduction in PECO’s rates during the first quar-
ter of 2001. The decrease in gas revenues was primarily
attributable to a decrease in rates through the purchased
gas adjustment clause that became effective in December
2001. The average rate per mmcf in 2002 was 22% lower than
the rate in 2001.
Resales and Other. Energy Delivery’s gas revenues decreased
as a result of a decrease in off-system sales, exchanges and
capacity releases.
Other Effects. The reduction in revenue from other effects is
primarily a result of a $38 million decrease in off-system
sales due to an expiration of wholesale contracts that were
offered by ComEd from June 2000 to May 2001 to support
the open access program in Illinois and a $15 million reversal
for revenue refunds in 2001 related to certain of ComEd’s
municipal customers as a result of a favorable FERC ruling,
partially offset by a reimbursement from Generation of $12
million at ComEd and an $11 million settlement of CTCs by a
large PECO customer in the first quarter of 2001.
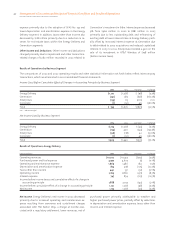
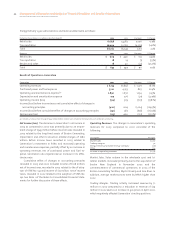
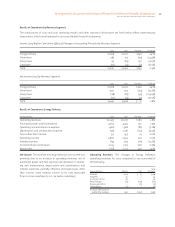
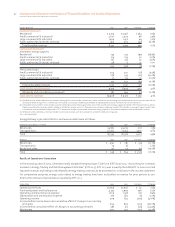
Purchased Power and Fuel Expense. The changes in Energy
Delivery’s purchased power and fuel expense for 2002 com-
pared to 2001 consisted of the following:
Energy Delivery Electric Gas Variance
Weather $ 69 $ – $ 69
Customer choice 65 – 65
Volume 54 – 54
PJM ancillary charges 41 – 41
Prices 18 (108) (90)
Other (15) 6 (9)
Increase (decrease) in
purchased power and fuel
expense $232 $(102) $ 130
Weather. Energy Delivery’s purchased power and fuel ex-
pense increased in 2002 compared to 2001 due to the im-
pacts of warmer than usual summer weather.
Customer Choice. Customer choice activity resulted in an in-
crease of purchased power and fuel expense, including $210
million due to customers selecting or returning to PECO as
their electric supplier, partially offset by $145 million due to
ComEd’s customers electing to purchase energy from alter-
native energy suppliers or electing ComEd’s PPO.
Volume. Energy Delivery’s purchased power and fuel expense
increased due to increases, exclusive of weather impacts, in
the number of customers and additional average usage per
customer, primarily in the residential customer class.
Prices. Fuel expense for gas decreased due to PECO’s higher
gas prices, which was partially offset by increases in the
weighted average on-peak/off-peak cost of electricity at
ComEd.
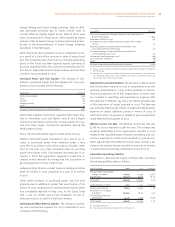
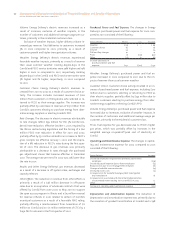
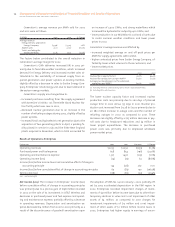
Operating and Maintenance Expense. The changes in operat-
ing and maintenance expense for 2002 compared to 2001
consisted of the following:
Energy Delivery Variance
Decreased employee fringe benefits primarily due to fewer
employees $(39)
Decreased payroll expense due to fewer employees (32)
Reduced costs due to cost management initiatives (16)
Change in bad debt reserve estimate (14)
Decreased storm costs (12)
Increased costs for manufactured gas plant investigation
and remediation 16
Increased costs associated with the initial implementation
of automated meter reading services at PECO in 2002 12
Other 3
Decrease in operating and maintenance expense $(82)
Depreciation and Amortization Expense. The reduction in
depreciation and amortization expense was primarily due to
the cessation of goodwill amortization at ComEd and a $48