ComEd 2003 Annual Report Download - page 136
Download and view the complete annual report
Please find page 136 of the 2003 ComEd annual report below. You can navigate through the pages in the report by either clicking on the pages listed below, or by using the keyword search tool below to find specific information within the annual report.-
 1
1 -
2
-
3
-
4
-
5
-
6
-
7
-
8
-
9
-
10
-
11
-
12
-
13
-
14
-
15
-
16
-
17
-
18
-
19
-
20
-
21
-
22
-
23
-
24
-
25
-
26
-
27
-
28
-
29
-
30
-
31
-
32
-
33
-
34
-
35
-
36
-
37
-
38
-
39
-
40
-
41
-
42
-
43
-
44
-
45
-
46
-
47
-
48
-
49
-
50
-
51
-
52
-
53
-
54
-
55
-
56
-
57
-
58
-
59
-
60
-
61
-
62
-
63
-
64
-
65
-
66
-
67
-
68
-
69
-
70
-
71
-
72
-
73
-
74
-
75
-
76
-
77
-
78
-
79
-
80
-
81
-
82
-
83
-
84
-
85
-
86
-
87
-
88
-
89
-
90
-
91
-
92
-
93
-
94
-
95
-
96
-
97
-
98
-
99
-
100
-
101
-
102
-
103
-
104
-
105
-
106
-
107
-
108
-
109
-
110
-
111
-
112
-
113
-
114
-
115
-
116
-
117
-
118
-
119
-
120
-
121
-
122
-
123
-
124
-
125
-
 126
126 -
 127
127 -
 128
128 -
 129
129 -
 130
130 -
 131
131 -
 132
132 -
 133
133 -
 134
134 -
 135
135 -
 136
136 -
 137
137 -
 138
138
 |
 |

134 Notes to Consolidated Financial Statements
EXELON CORPORATION AND SUBSIDIARY COMPANIES
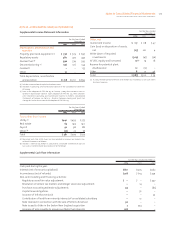
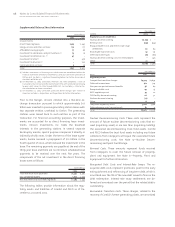
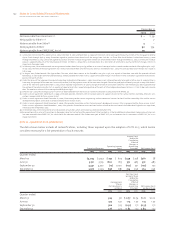
The following table presents average shares of common
stock outstanding (basic and diluted), earnings per aver-
age common share (basic and diluted) and dividends per
common share for the years ended December 31, 2003, 2002
and 2001 on a pro forma basis as if the stock split had
been reflected in the accompanying consolidated financial
statements.
For the Years Ended December 31,
2003 2002 2001
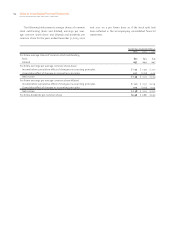
Pro forma average shares of common stock outstanding
Basic 651 645 641
Diluted 657 649 645
Pro forma earnings per average common share–basic:
Income before cumulative effect of changes in accounting principles $ 1.22 $ 2.59 $ 2.21
Cumulative effect of changes in accounting principles 0.17 (0.36) 0.02
Net income $ 1.39 $ 2.23 $ 2.23
Pro forma earnings per average common share–diluted:
Income before cumulative effect of changes in accounting principles $ 1.21 $ 2.57 $ 2.19
Cumulative effect of changes in accounting principles 0.17 (0.35) 0.02
Net income $ 1.38 $ 2.22 $ 2.21
Pro forma dividends per common share $0.96 $ 0.88 $ 0.91