ComEd 2003 Annual Report Download - page 132
Download and view the complete annual report
Please find page 132 of the 2003 ComEd annual report below. You can navigate through the pages in the report by either clicking on the pages listed below, or by using the keyword search tool below to find specific information within the annual report.-
 1
1 -
2
-
3
-
4
-
5
-
6
-
7
-
8
-
9
-
10
-
11
-
12
-
13
-
14
-
15
-
16
-
17
-
18
-
19
-
20
-
21
-
22
-
23
-
24
-
25
-
26
-
27
-
28
-
29
-
30
-
31
-
32
-
33
-
34
-
35
-
36
-
37
-
38
-
39
-
40
-
41
-
42
-
43
-
44
-
45
-
46
-
47
-
48
-
49
-
50
-
51
-
52
-
53
-
54
-
55
-
56
-
57
-
58
-
59
-
60
-
61
-
62
-
63
-
64
-
65
-
66
-
67
-
68
-
69
-
70
-
71
-
72
-
73
-
74
-
75
-
76
-
77
-
78
-
79
-
80
-
81
-
82
-
83
-
84
-
85
-
86
-
87
-
88
-
89
-
90
-
91
-
92
-
93
-
94
-
95
-
96
-
97
-
98
-
99
-
100
-
101
-
102
-
103
-
104
-
105
-
106
-
107
-
108
-
109
-
110
-
111
-
112
-
113
-
114
-
115
-
116
-
117
-
118
-
119
-
120
-
121
-
 122
122 -
 123
123 -
 124
124 -
 125
125 -
 126
126 -
 127
127 -
 128
128 -
 129
129 -
 130
130 -
 131
131 -
 132
132 -
 133
133 -
 134
134 -
 135
135 -
 136
136 -
 137
137 -
 138
138
 |
 |

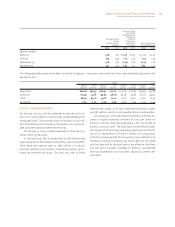
130 Notes to Consolidated Financial Statements
EXELON CORPORATION AND SUBSIDIARY COMPANIES
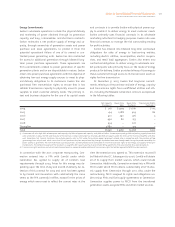
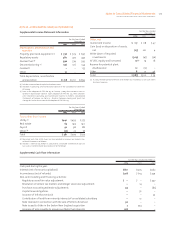
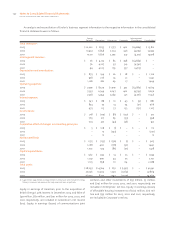
An analysis and reconciliation of Exelon’s business segment information to the respective information in the consolidated
financial statements were as follows:
Energy
Delivery Generation Enterprises Corporate
Intersegment
Eliminations Consolidated
Total revenues(1):
2003 $ 10,202 $ 8,135 $ 1,757 $ 402 $(4,684) $ 15,812
2002 10,457 6,858 2,033 346 (4,739) 14,955
2001 10,171 6,826 2,292 341 (4,712) 14,918
Intersegment revenues:
2003 $ 76 $ 4,125 $ 85 $ 398 $(4,684) $ –
2002 76 4,227 97 341 (4,741) –
2001 94 4,103 179 337 (4,713) –
Depreciation and amortization:
2003 $ 873 $ 199 $ 26 $ 28 $ – $ 1,126
2002 978 276 55 31 – 1,340
2001 1,081 282 69 17 – 1,449
Operating expenses:
2003 $ 7,579 $ 8,329 $ 1,919 $ 472 $(4,685) $ 13,614
2002 7,597 6,349 2,047 402 (4,739) 11,656
2001 7,578 5,954 2,369 371 (4,716) 11,556
Interest expense:
2003 $ 747 $ 88 $ 10 $ 45 $ (9) $ 881
2002 854 75 14 74 (51) 966
2001 973 115 37 133 (151) 1,107
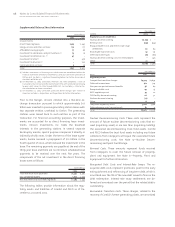
Income taxes:
2003 $ 718 $ (179) $ (81) $ (127) $ – $ 331
2002 765 217 69 (53) – 998
2001 703 327 (43) (56) – 931
Cumulative effect of changes in accounting principles:
2003 $ 5 $ 108 $ (1) $ – $ – $ 112
2002 – 13 (243) – – (230)
2001 – 12 – – – 12
Net income/(loss):
2003 $ 1,175 $ (133) $ (136) $ (1) $ – $ 905
2002 1,268 400 (178) (50) – 1,440
2001 1,022 524 (85) (33) – 1,428
Capital expenditures:
2003 $ 962 $ 953 $ 14 $ 25 $ – $ 1,954
2002 1,041 990 44 75 – 2,150
2001 1,105 858 61 64 – 2,088
Total assets:
2003 $ 28,297 $ 14,764 $ 831 $ (1,951) $ – $ 41,941
2002 27,036 10,905 1,297 (1,369) – 37,869
2001 26,590 8,145 1,743 (1,509) – 34,969
(1) $439 million, $439 million and $373 million in utility taxes were included in Energy
Delivery’s revenues and expenses for 2003, 2002 and 2001, respectively.
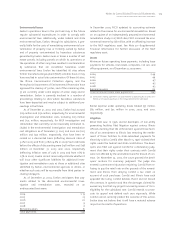
Equity in earnings of AmerGen, prior to the acquisition of
British Energy’s 50% interest in December 2003, and Sithe of
$49 million, $87 million, and $90 million for 2003, 2002, and
2001, respectively, are included in Generation’s net income
(loss). Equity in earnings (losses) of communications joint
ventures and other investments of $(5) million, $3 million,
and $(19) million for 2003, 2002, and 2001, respectively, are
included in Enterprises’ net loss. Equity in earnings (losses)
of affordable housing investments of $(10) million, $(11) mil-
lion and $(9) million for 2003, 2002 and 2001, respectively,
are included in Corporate’s net loss.