Clearwire 2009 Annual Report Download - page 95
Download and view the complete annual report
Please find page 95 of the 2009 Clearwire annual report below. You can navigate through the pages in the report by either clicking on the pages listed below, or by using the keyword search tool below to find specific information within the annual report.-
 1
1 -
2
-
3
-
4
-
5
-
6
-
7
-
8
-
9
-
10
-
11
-
12
-
13
-
14
-
15
-
16
-
17
-
18
-
19
-
20
-
21
-
22
-
23
-
24
-
25
-
26
-
27
-
28
-
29
-
30
-
31
-
32
-
33
-
34
-
35
-
36
-
37
-
38
-
39
-
40
-
41
-
42
-
43
-
44
-
45
-
46
-
47
-
48
-
49
-
50
-
51
-
52
-
53
-
54
-
55
-
56
-
57
-
58
-
59
-
60
-
61
-
62
-
63
-
64
-
65
-
66
-
67
-
68
-
69
-
70
-
71
-
72
-
73
-
74
-
75
-
76
-
77
-
78
-
79
-
80
-
81
-
82
-
83
-
84
-
 85
85 -
 86
86 -
 87
87 -
 88
88 -
 89
89 -
 90
90 -
 91
91 -
 92
92 -
 93
93 -
 94
94 -
 95
95 -
 96
96 -
 97
97 -
 98
98 -
 99
99 -
 100
100 -
 101
101 -
 102
102 -
 103
103 -
 104
104 -
 105
105 -
106
-
107
-
108
-
109
-
110
-
111
-
112
-
113
-
114
-
115
-
116
-
117
-
118
-
119
-
120
-
121
-
122
-
123
-
124
-
125
-
126
-
127
-
128
-
129
-
130
-
131
-
132
-
133
-
134
-
135
-
136
-
137
-
138
-
139
-
140
-
141
-
142
-
143
-
144
-
145
-
146
 |
 |
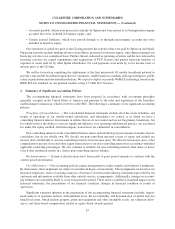
We max
i
m
i
ze t
h
e use o
f
o
b
serva
bl
e
i
nputs an
d
m
i
n
i
m
i
ze t
h
e use o
f
uno
b
serva
bl
e
i
nputs w
h
en
d
eve
l
op
i
ng
f
a
ir
va
l
ue measurements. I
fli
ste
d
pr
i
ces or quotes are not ava
il
a
bl
e,
f
a
i
rva
l
ue
i
s
b
ase
d
upon
i
nterna
ll
y
d
eve
l
ope
d
m
odels that primaril
y
use, as inputs, market-based or independentl
y
sourced market parameters, includin
g
but not
li
m
i
te
d
to
i
nterest rate y
i
e
ld
curves, vo
l
at
ili
t
i
es, equ
i
ty or
d
e
b
tpr
i
ces, an
d
cre
di
t curves. We ut
ili
ze certa
i
n
assumpt
i
ons t
h
at mar
k
et part
i
c
i
pants wou
ld
use
i
npr
i
c
i
ng t
h
e
fi
nanc
i
a
li
nstrument,
i
nc
l
u
di
ng assumpt
i
ons a
b
out
r
isk, such as credit, inherent and default risk. The de
g
ree of mana
g
ement
j
ud
g
ment involved in determinin
g
the fai
r
value of a financial instrument is dependent upon the availability of quoted market prices or observable marke
t
p
arameters. For
fi
nanc
i
a
li
nstruments t
h
at tra
d
e act
i
ve
ly
an
dh
ave quote
d
mar
k
et pr
i
ces or o
b
serva
bl
e mar
k
et
p
arameters, t
h
ere
i
sm
i
n
i
ma
lj
u
dg
ment
i
nvo
l
ve
di
n measur
i
n
gf
a
i
rva
l
ue. W
h
en o
b
serva
bl
e mar
k
et pr
i
ces an
d
p
arameters are not fully available, management judgment is necessary to estimate fair value. In addition, changes in
m
ar
k
et con
di
t
i
ons ma
y
re
d
uce t
h
eava
il
a
bili
t
y
an
d
re
li
a
bili
t
y
o
f
quote
d
pr
i
ces or o
b
serva
bl
e
d
ata. In t
h
ese
i
nstances
,
w
e use certa
i
n uno
b
serva
bl
e
i
nputs t
h
at cannot
b
eva
lid
ate
dby
re
f
erence to a rea
dily
o
b
serva
bl
e mar
k
et or exc
h
an
ge
data and rel
y
, to a certain extent, on our own assumptions about the assumptions that a market participant would us
e
i
npr
i
c
i
ng t
h
e secur
i
ty. T
h
ese
i
nterna
ll
y
d
er
i
ve
d
va
l
ues are compare
d
w
i
t
h
non-
bi
n
di
ng va
l
ues rece
i
ve
df
rom
b
ro
k
ers
or ot
h
er
i
n
d
epen
d
ent sources, as ava
il
a
bl
e. See Note 12, Fa
i
rVa
l
ue,
f
or
f
urt
h
er
i
n
f
ormat
i
on.
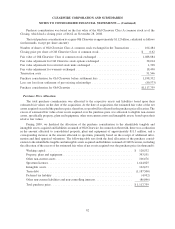
Accounts Receivabl
e
—
Accounts receivables are stated at amounts due from customers net of an allowance
for doubtful accounts
.
I
nventor
y
— Inventory primarily consists of customer premise equipment, which we refer to as CPE, and othe
r
accessories sold to customers and is stated at the lower of cost or net realizable value. Cost is determined under the
avera
g
e cost met
h
o
d
. We recor
di
nventor
y
wr
i
te-
d
owns
f
or o
b
so
l
ete an
d
s
l
ow-mov
i
n
gi
tems
b
ase
d
on
i
nventor
y
turnover trends and historical ex
p
erience
.
P
roperty, Plant and E
q
uipmen
t
— Propert
y
, plant and equipment, which we refer to as PP&E, is stated at cost,
n
et o
f
accumu
l
ate
dd
eprec
i
at
i
on. Deprec
i
at
i
on
i
sca
l
cu
l
ate
d
on a stra
i
g
h
t-
li
ne
b
as
i
sovert
h
e est
i
mate
d
use
f
u
lli
ves o
f
t
h
e assets once t
h
e assets are p
l
ace
di
n serv
i
ce. Our networ
k
construct
i
on expen
di
tures are recor
d
e
d
as construct
i
o
n
i
n pro
g
ress until the network or other asset is placed in service, at which time the asset is transferred to the
appropriate PP&E category. We capitalize costs of additions and improvements, including direct costs of con-
s
truct
i
ng PP&E an
di
nterest costs re
l
ate
d
to construct
i
on. T
h
e est
i
mate
d
use
f
u
l lif
eo
f
equ
i
pment
i
s
d
eterm
i
ne
d
b
ase
d
on
hi
stor
i
ca
l
usa
g
eo
fid
ent
i
ca
l
or s
i
m
il
ar equ
i
pment, w
i
t
h
cons
id
erat
i
on
gi
ven to tec
h
no
l
o
gi
ca
l
c
h
an
g
es an
d
i
ndustry trends that could impact the network architecture and asset utilization. Leasehold improvements are
r
ecorded at cost and amortized over the lesser of their estimated useful lives or the related lease term, including
r
enewa
l
st
h
at are reasona
bly
assure
d
.Ma
i
ntenance an
d
repa
i
rs are expense
d
as
i
ncurre
d
.
PP&E
i
s assesse
df
or
i
mpa
i
rment w
h
enever events or c
h
an
g
es
i
nc
i
rcumstances
i
n
di
cate t
h
at t
h
e carr
yi
n
g
amount of an asset ma
y
not be recoverable. When such events or circumstances exist, we would determine the
r
ecovera
bili
ty o
f
t
h
e asset’s carry
i
ng va
l
ue
b
y est
i
mat
i
ng t
h
e expecte
d
un
di
scounte
df
uture cas
hfl
ows t
h
at are
di
rect
l
y assoc
i
ate
d
w
i
t
h
an
d
t
h
at are expecte
d
to ar
i
se as a
di
rect resu
l
to
f
t
h
e use o
f
t
h
e asset. I
f
t
h
e expecte
d
undiscounted future cash flows are less than the carr
y
in
g
amount of the asset, a loss is reco
g
nized for the difference
.
For purposes o
f
recogn
i
t
i
on an
d
measurement, we group our
l
ong-
li
ve
d
assets,
i
nc
l
u
di
ng PP&E an
di
ntang
ible
assets w
i
t
hd
e
fi
n
i
te use
f
u
lli
ves, at t
h
e
l
owest
l
eve
lf
or w
hi
c
h
t
h
ere are
id
ent
ifi
a
bl
e cas
hfl
ows w
hi
c
h
are
l
arge
l
y
i
ndependent of other assets and liabilities, and we test for impairment on an a
gg
re
g
ated basis for assets in the United
S
tates consistent with the management of the business on a national scope. There were no PP&E impairment losse
s
r
ecor
d
e
di
nt
h
e years en
d
e
d
Decem
b
er 31, 2009, 2008 an
d
2007.
I
na
ddi
t
i
on to t
h
e ana
l
yses
d
escr
ib
e
d
a
b
ove, we per
i
o
di
ca
ll
y assess certa
i
n assets t
h
at
h
ave not yet
b
ee
n
d
ep
l
o
y
e
di
n our networ
k
,
i
nc
l
u
di
n
g
equ
i
pment an
d
ce
ll
s
i
te
d
eve
l
opment costs. T
hi
s assessment
i
nc
l
u
d
es t
h
ewr
i
te-
off of network equipment for estimated shrinka
g
e experienced durin
g
the deplo
y
ment process and the write-off o
f
n
etwor
k
equ
i
pment an
d
ce
ll
s
i
te
d
eve
l
opment costs w
h
enever events or c
h
anges
i
nc
i
rcumstances cause us t
o
c
onc
l
u
d
et
h
at suc
h
assets are no
l
onger nee
d
e
d
to meet management’s strateg
i
c networ
k
p
l
ans an
d
w
ill
not
be
deplo
y
ed.
85
CLEARWIRE CORPORATION AND
S
UB
S
IDIARIE
S
N
OTES TO CONSOLIDATED FINANCIAL STATEMENTS —
(
Continued
)