Clearwire 2009 Annual Report Download - page 57
Download and view the complete annual report
Please find page 57 of the 2009 Clearwire annual report below. You can navigate through the pages in the report by either clicking on the pages listed below, or by using the keyword search tool below to find specific information within the annual report.-
 1
1 -
2
-
3
-
4
-
5
-
6
-
7
-
8
-
9
-
10
-
11
-
12
-
13
-
14
-
15
-
16
-
17
-
18
-
19
-
20
-
21
-
22
-
23
-
24
-
25
-
26
-
27
-
28
-
29
-
30
-
31
-
32
-
33
-
34
-
35
-
36
-
37
-
38
-
39
-
40
-
41
-
42
-
43
-
44
-
45
-
46
-
 47
47 -
 48
48 -
 49
49 -
 50
50 -
 51
51 -
 52
52 -
 53
53 -
 54
54 -
 55
55 -
 56
56 -
 57
57 -
 58
58 -
 59
59 -
 60
60 -
 61
61 -
 62
62 -
 63
63 -
 64
64 -
 65
65 -
 66
66 -
 67
67 -
68
-
69
-
70
-
71
-
72
-
73
-
74
-
75
-
76
-
77
-
78
-
79
-
80
-
81
-
82
-
83
-
84
-
85
-
86
-
87
-
88
-
89
-
90
-
91
-
92
-
93
-
94
-
95
-
96
-
97
-
98
-
99
-
100
-
101
-
102
-
103
-
104
-
105
-
106
-
107
-
108
-
109
-
110
-
111
-
112
-
113
-
114
-
115
-
116
-
117
-
118
-
119
-
120
-
121
-
122
-
123
-
124
-
125
-
126
-
127
-
128
-
129
-
130
-
131
-
132
-
133
-
134
-
135
-
136
-
137
-
138
-
139
-
140
-
141
-
142
-
143
-
144
-
145
-
146
 |
 |

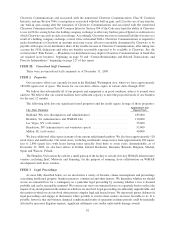
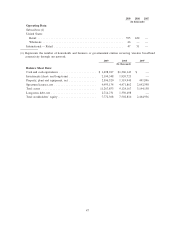
2
009 2008 2007
(
In thousands
)
O
perating Data:
Su
b
scr
ib
ers:(1)
U
n
i
te
dS
tates:
R
eta
il
..
.
.................................................. 5
9
5 424 —
W
h
o
l
esa
l
e.................................................. 4
6
——
I
n
te
rn
at
i
o
n
a
l—R
eta
i
l
........................................... 47
5
1—
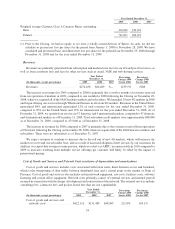
(1) Represents the number of households and business or
g
overnmental entities receivin
g
wireless broadban
d
c
onnectivit
y
throu
g
h our network.
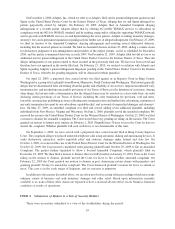
2
009 2008 2007
(
In thousands
)
B
alance
S
heet Data
:
C
as
h
an
d
cas
h
e
q
u
i
va
l
ents .......................
$
1,698,017 $1,206,143 $ —
I
nvestments (s
h
ort- an
dl
on
g
-term
)
.................
2,194,348 1,920,
7
23
—
P
roperty, p
l
ant an
d
equ
i
pment, net
.................
2
,
596
,
520 1
,
319
,
945 491
,
896
S
pectrum
li
censes, ne
t
.......................... 4
,
495
,
134 4
,
471
,
862 2
,
642
,
59
0
Tota
l
assets
..................................
1
1
,
267
,
8
5
39
,
124
,
167 3
,
144
,
1
5
8
Lon
g
-term debt, ne
t
............................
2,714,731 1,3
5
0,498 —
T
otal stockholders’ equit
y
........................
7,772,368 7,
5
02,810 2,464,93
6
4
7