Clearwire 2009 Annual Report Download - page 64
Download and view the complete annual report
Please find page 64 of the 2009 Clearwire annual report below. You can navigate through the pages in the report by either clicking on the pages listed below, or by using the keyword search tool below to find specific information within the annual report.-
 1
1 -
2
-
3
-
4
-
5
-
6
-
7
-
8
-
9
-
10
-
11
-
12
-
13
-
14
-
15
-
16
-
17
-
18
-
19
-
20
-
21
-
22
-
23
-
24
-
25
-
26
-
27
-
28
-
29
-
30
-
31
-
32
-
33
-
34
-
35
-
36
-
37
-
38
-
39
-
40
-
41
-
42
-
43
-
44
-
45
-
46
-
47
-
48
-
49
-
50
-
51
-
52
-
53
-
 54
54 -
 55
55 -
 56
56 -
 57
57 -
 58
58 -
 59
59 -
 60
60 -
 61
61 -
 62
62 -
 63
63 -
 64
64 -
 65
65 -
 66
66 -
 67
67 -
 68
68 -
 69
69 -
 70
70 -
 71
71 -
 72
72 -
 73
73 -
 74
74 -
75
-
76
-
77
-
78
-
79
-
80
-
81
-
82
-
83
-
84
-
85
-
86
-
87
-
88
-
89
-
90
-
91
-
92
-
93
-
94
-
95
-
96
-
97
-
98
-
99
-
100
-
101
-
102
-
103
-
104
-
105
-
106
-
107
-
108
-
109
-
110
-
111
-
112
-
113
-
114
-
115
-
116
-
117
-
118
-
119
-
120
-
121
-
122
-
123
-
124
-
125
-
126
-
127
-
128
-
129
-
130
-
131
-
132
-
133
-
134
-
135
-
136
-
137
-
138
-
139
-
140
-
141
-
142
-
143
-
144
-
145
-
146
 |
 |

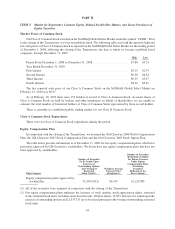
2009 2008 200
7
Year Ended December
31,
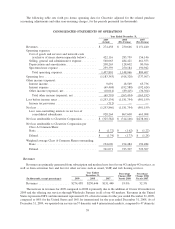
We
igh
te
d
avera
g
eC
l
earw
i
re C
l
ass A Common S
h
ares outstan
di
n
g:
Basic
.
...................................................
194
,
696 189
,
92
1
Dil
uted
...................................................
741,071 694,92
1
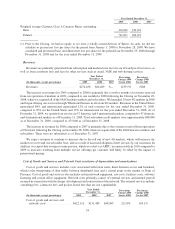
(1) Pr
i
or to t
h
eC
l
os
i
ng, we
h
a
d
no equ
i
ty as we were a w
h
o
ll
y-owne
ddi
v
i
s
i
on o
f
Spr
i
nt. As suc
h
,we
did
not
c
alculate or present net loss per share for the period from Januar
y
1, 2008 to November 28, 2008. We have
c
alculated and presented basic and diluted net loss per share for the period from November 29, 2008 throu
gh
D
ecem
b
er 31, 2008 an
df
or t
h
e year en
d
e
d
Decem
b
er 31, 2009.
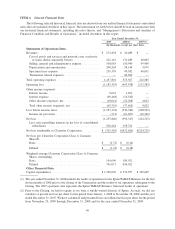
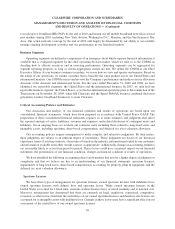
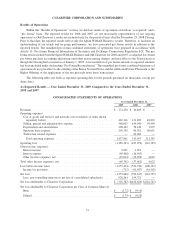
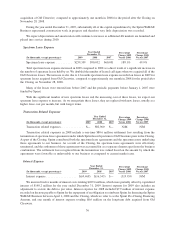
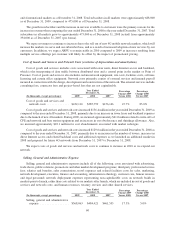
Reve
nu
es
R
evenues are pr
i
mar
ily g
enerate
df
rom su
b
scr
i
pt
i
on an
d
mo
d
em
l
ease
f
ees
f
or our 4G an
d
pre-4G serv
i
ces, a
s
well as from activation fees and fees for other services such as email, VoIP, and web hosting services
.
(
In thousands, except percenta
g
es) 2009 2008 200
7
P
ercenta
g
e
C
han
g
e 2009
V
ersus
2008
P
ercenta
ge
C
han
g
e 2008
V
ersus
200
7
Year Ende
d
December
31,
R
evenues
........................
$274,458 $20,489 $— 1239.5% N/M
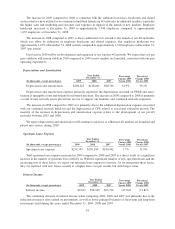
T
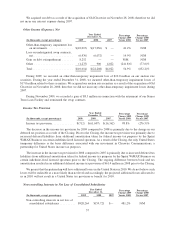
he increase in revenues for 2009 compared to 2008 is primaril
y
due to twelve months of revenues received
f
rom our operat
i
on o
f
mar
k
ets
i
n 2009, compare
d
to one mont
hf
or 2008
f
o
ll
ow
i
ng t
h
eC
l
os
i
ng on Novem
b
er 28,
2
008, w
h
en we acqu
i
re
d
a
ll
o
f
t
h
eO
ld
C
l
earw
i
re mar
k
ets an
d
su
b
scr
ib
ers. We
l
aunc
h
e
d
10 new 4G mar
k
ets
i
n 2009
an
db
e
g
an o
ff
er
i
n
g
our serv
i
ces t
h
rou
gh
W
h
o
l
esa
l
e Partners
i
na
ll
o
f
our 4G mar
k
ets. Revenues
i
nt
h
eUn
i
te
d
States
r
epresented 88% and international represented 12% of total revenues for the year ended December 31, 2009,
c
ompare
d
to 87%
f
or t
h
eUn
i
te
d
States an
d
13%
f
or
i
nternat
i
ona
lf
or t
h
e year en
d
e
d
Decem
b
er 31, 2008. As o
f
D
ecember 31, 2009, we o
p
erated our services in 57 domestic and 4 international markets, com
p
ared to 47 domestic
and 4 international markets as of December 31, 2008. Total subscribers in all markets were approximatel
y
688,00
0
as of December 31, 2009, com
p
ared to 47
5
,000 as of December 31, 2008.
T
he increase in revenues for 2008 compared to 2007 is primaril
y
due to the revenues received from operation
s
o
f
C
l
earw
i
re
f
o
ll
ow
i
ng t
h
eC
l
os
i
ng on Novem
b
er 28, 2008, w
h
en we acqu
i
re
d
a
ll
o
f
t
h
eO
ld
C
l
earw
i
re mar
k
ets an
d
s
ubscribers. There were no subscribers as of December 31, 2007.
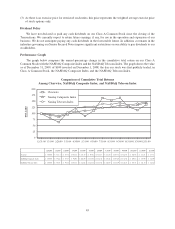
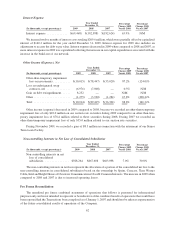
We ex
p
ect revenues to continue to increase due to the roll out of new 4G markets, which will increase th
e
m
arkets we serve and our subscriber base, and as a result of increased adoption of new services b
y
our customers. I
n
a
ddi
t
i
on, we expect t
h
at average revenue per user, w
hi
c
h
we re
f
er to as ARPU, to rema
i
n sta
bl
e
i
n 2010 compare
d
t
o
2
009 as
i
ncreases resu
l
t
i
n
gf
rom mu
l
t
i
p
l
e serv
i
ce o
ff
er
i
n
g
s per customer w
ill lik
e
ly b
eo
ff
set
by
t
h
e
i
mpact o
f
p
romotional pricin
g.
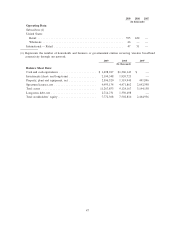
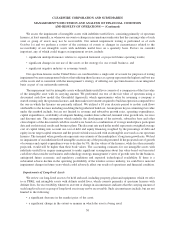
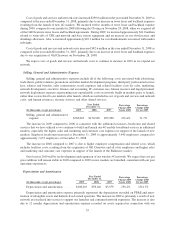
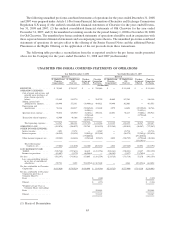
C
ost o
f
Goo
d
san
d
Services an
d
Networ
k
Costs (exc
l
usive o
fd
e
p
reciation an
d
amortization
)
C
ost of
g
oods and services includes costs associated with tower rents, direct Internet access and backhaul,
whi
c
hi
st
h
e transport
i
ng o
fd
ata tra
ffi
c
b
etween
di
str
ib
ute
d
s
i
tes an
d
a centra
l
po
i
nt
i
nt
h
e mar
k
et or Po
i
nt o
f
P
resence. Cost of
g
oods and services also includes certain network equipment, site costs, facilities costs, software
licensin
g
and certain office equipment. Network costs primaril
y
consist of external services and internal pa
y
roll
i
ncurre
di
n connect
i
on w
i
t
h
t
h
e
d
es
i
gn,
d
eve
l
opment an
d
construct
i
on o
f
t
h
e networ
k
.T
h
e externa
l
serv
i
ces
i
nc
l
u
de
c
onsultin
g
fees, contractor fees and pro
j
ect-based fees that are not capitalizable
.
(
In thousands, except percentages
)
2009 2008 2007
P
ercenta
g
e
Change 2009
Versus
2008
P
ercenta
ge
C
hange 2008
Versus
200
7
Y
ear Ended
D
ecember
31,
C
ost of goods and services an
d
net
w
or
k
cost
s
...............
$
422
,
116
$
131
,
489
$
48
,
865 221.0% 169.1
%
54