Clearwire 2009 Annual Report Download - page 79
Download and view the complete annual report
Please find page 79 of the 2009 Clearwire annual report below. You can navigate through the pages in the report by either clicking on the pages listed below, or by using the keyword search tool below to find specific information within the annual report.-
 1
1 -
2
-
3
-
4
-
5
-
6
-
7
-
8
-
9
-
10
-
11
-
12
-
13
-
14
-
15
-
16
-
17
-
18
-
19
-
20
-
21
-
22
-
23
-
24
-
25
-
26
-
27
-
28
-
29
-
30
-
31
-
32
-
33
-
34
-
35
-
36
-
37
-
38
-
39
-
40
-
41
-
42
-
43
-
44
-
45
-
46
-
47
-
48
-
49
-
50
-
51
-
52
-
53
-
54
-
55
-
56
-
57
-
58
-
59
-
60
-
61
-
62
-
63
-
64
-
65
-
66
-
67
-
68
-
 69
69 -
 70
70 -
 71
71 -
 72
72 -
 73
73 -
 74
74 -
 75
75 -
 76
76 -
 77
77 -
 78
78 -
 79
79 -
 80
80 -
 81
81 -
 82
82 -
 83
83 -
 84
84 -
 85
85 -
 86
86 -
 87
87 -
 88
88 -
 89
89 -
90
-
91
-
92
-
93
-
94
-
95
-
96
-
97
-
98
-
99
-
100
-
101
-
102
-
103
-
104
-
105
-
106
-
107
-
108
-
109
-
110
-
111
-
112
-
113
-
114
-
115
-
116
-
117
-
118
-
119
-
120
-
121
-
122
-
123
-
124
-
125
-
126
-
127
-
128
-
129
-
130
-
131
-
132
-
133
-
134
-
135
-
136
-
137
-
138
-
139
-
140
-
141
-
142
-
143
-
144
-
145
-
146
 |
 |

C
as
h
F
l
ow Ana
ly
si
s
T
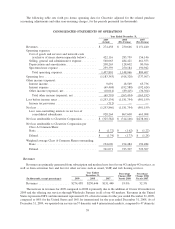
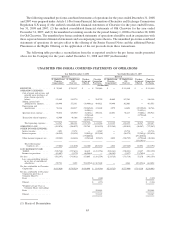
he followin
g
anal
y
sis includes the sources and uses of cash for the Sprint WiMAX Business for the first
e
leven months of 2008 prior to the Closin
g
and for 2007, and the sources and uses of cash for Clearwire subsequent
t
ot
h
eC
l
os
i
ng
.
Th
e statement o
f
cas
hfl
ows
i
nc
l
u
d
es t
h
e act
i
v
i
t
i
es t
h
at were pa
id b
y Spr
i
nt on
b
e
h
a
lf
o
f
us pr
i
or to t
h
eC
l
os
i
ng.
Financin
g
activities include fundin
g
advances from Sprint throu
g
h November 28, 2008. Further, the net cash used i
n
operatin
g
activities and the net cash used in investin
g
activities for capital expenditures and acquisitions of spectru
m
li
censes an
d
patents represent trans
f
ers o
f
expenses or assets pa
id f
or
b
yot
h
er Spr
i
nt su
b
s
idi
ar
i
es.
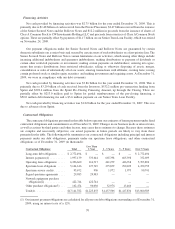
Th
e
f
o
ll
ow
i
ng ta
bl
e presents a summary o
f
our cas
hfl
ows an
db
eg
i
nn
i
ng an
d
en
di
ng cas
hb
a
l
ances
f
or t
he
y
ears ended December 31, 2009, 2008 and 2007 (in thousands):
2009 2008 200
7
Year Ended December
31,
Net cash used in operatin
g
activities
.
...............
$
(472,484) $ (406,306) $ (339,519
)
Net cash used in investin
g
activities
................
(1,782,999) (2,24
5
,830) (683,080)
Net cas
h
prov
id
e
db
y
fi
nanc
i
ng act
i
v
i
t
i
e
s
............
2,
745
,
847 3
,
857
,
755 1
,
022
,
59
9
E
ff
ect o
ff
ore
i
gn currency exc
h
ange rates on cas
h
an
d
cas
h
equ
i
va
l
ents
.............................
1,
510 524 —
T
otal net cash flo
ws
............................
4
91
,
874 1
,
206
,
143 —
C
ash and cash equivalents at beginning of period
.
....
.
1
,
206
,
143 — —
C
ash and cash e
q
uivalents at end of
p
eriod
.
..........
$
1,698,017 $ 1,206,143 $
—
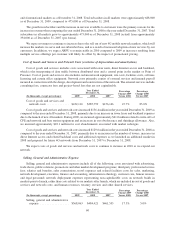
Op
erating Activitie
s
N
et cash used in operating activities was
$
472.5 million for the year ended December 31, 2009 compared to
$
406.3 million in 2008. The increase is due primaril
y
to an increase in all operatin
g
expenses, as we continue to
e
xpand and operate our business, and interest payments to service debt. This is partially offset by
$
268.1 million in
c
as
h
rece
i
ve
df
rom customers, w
hi
c
hi
ncrease
d
as we grew our su
b
scr
ib
ers an
dl
aunc
h
e
d
a
ddi
t
i
ona
l
mar
k
ets
.
N
et cash used in operatin
g
activities for the
y
ears ended December 31, 2008 and 2007 was due primaril
y
to
p
a
y
ments for operatin
g
expenses, as we continue to expand and operate our business. For the
y
ear ende
d
D
ecem
b
er 31, 2008, net cas
h
use
di
n operat
i
ng act
i
v
i
t
i
es a
l
so
i
nc
l
u
d
e
di
nterest payments to serv
i
ce
d
e
b
t. T
he
2008 net cash used is partiall
y
offset b
y
$20.2 million in cash received from customers.
Invest
i
n
g
Act
i
v
i
t
i
es
Durin
g
the
y
ear ended December 31, 2009, net cash used in investin
g
activities was $1.78 billion. The net cas
h
u
sed in investin
g
activities was due primaril
y
to $1.45 billion in cash paid for PP&E, $290.7 million in net purchases
of available-for-sale securities and
$
46.8 million in payments for acquisition of spectrum licenses and othe
r
i
ntan
gibl
es
.
Durin
g
the
y
ear ended December 31, 2008, net cash used in investin
g
activities was $2.25 billion. The net cas
h
u
sed in investin
g
activities was due primaril
y
to $1.77 billion in purchases of available-for-sale securities followin
g
the
$
3.2 billion cash investment from the Investors,
$
534.2 million in cash paid for PP&E and
$
109.3 million in
p
a
y
ments
f
or acqu
i
s
i
t
i
on o
f
spectrum
li
censes an
d
ot
h
er
i
ntan
gibl
es. T
h
ese uses o
f
cas
h
were part
i
a
lly
o
ff
set
by
$
171.8 million of cash acquired from Old Clearwire as a result of the Closing.
During the year ended December 31, 2007, net cash used in investing activities was
$
683.1 million. The net
c
ash used in investing activities is due to
$
353.6 million in payments for acquisition of spectrum licenses and other
i
ntan
g
ibles and $329.5 million in cash paid for PP&E.
69