Clearwire 2009 Annual Report Download - page 69
Download and view the complete annual report
Please find page 69 of the 2009 Clearwire annual report below. You can navigate through the pages in the report by either clicking on the pages listed below, or by using the keyword search tool below to find specific information within the annual report.-
 1
1 -
2
-
3
-
4
-
5
-
6
-
7
-
8
-
9
-
10
-
11
-
12
-
13
-
14
-
15
-
16
-
17
-
18
-
19
-
20
-
21
-
22
-
23
-
24
-
25
-
26
-
27
-
28
-
29
-
30
-
31
-
32
-
33
-
34
-
35
-
36
-
37
-
38
-
39
-
40
-
41
-
42
-
43
-
44
-
45
-
46
-
47
-
48
-
49
-
50
-
51
-
52
-
53
-
54
-
55
-
56
-
57
-
58
-
 59
59 -
 60
60 -
 61
61 -
 62
62 -
 63
63 -
 64
64 -
 65
65 -
 66
66 -
 67
67 -
 68
68 -
 69
69 -
 70
70 -
 71
71 -
 72
72 -
 73
73 -
 74
74 -
 75
75 -
 76
76 -
 77
77 -
 78
78 -
 79
79 -
80
-
81
-
82
-
83
-
84
-
85
-
86
-
87
-
88
-
89
-
90
-
91
-
92
-
93
-
94
-
95
-
96
-
97
-
98
-
99
-
100
-
101
-
102
-
103
-
104
-
105
-
106
-
107
-
108
-
109
-
110
-
111
-
112
-
113
-
114
-
115
-
116
-
117
-
118
-
119
-
120
-
121
-
122
-
123
-
124
-
125
-
126
-
127
-
128
-
129
-
130
-
131
-
132
-
133
-
134
-
135
-
136
-
137
-
138
-
139
-
140
-
141
-
142
-
143
-
144
-
145
-
146
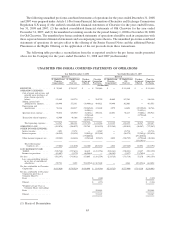
 |
 |

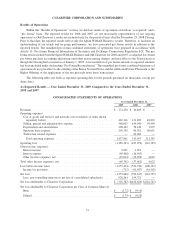
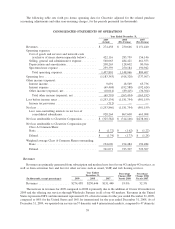
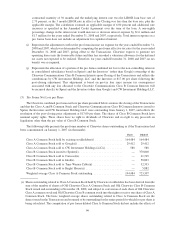
Th
e
f
o
ll
ow
i
ng ta
bl
e sets
f
ort
h
pro
f
orma operat
i
ng
d
ata
f
or C
l
earw
i
re a
dj
uste
df
or t
h
ere
l
ate
d
purc
h
as
e
accountin
g
ad
j
ustments and other non-recurrin
g
char
g
es, for the periods presented (in thousands):
CO
N
SO
LIDATED
S
TATEMENT
SO
F
O
PERATI
O
N
S
2009
(
Actual
)
2008
(
Pro Forma
)
2007
(
Pro Forma
)
Y
ear Ended December
31,
R
evenues
.
................................... $ 274,458 $ 230,646 $ 151,440
O
perat
i
ng expenses:
C
ost o
fg
oo
d
san
d
serv
i
ces an
d
networ
k
costs
(
exclusive of items shown separatel
y
below)
......
422,116 28
5
,7
5
91
5
6,14
6
Sellin
g
,
g
eneral and administrative expens
e
.........
5
68,063 484,421 461,
553
D
eprec
i
at
i
on an
d
amort
i
zat
i
on
.
.................. 208
,
263 128
,
602 80
,
766
S
p
ectrum
l
ease ex
p
ense
.......................
259,359 250,184 190,942
Tota
l
operat
i
n
g
expense
s
.....................
1
,457,801 1,148,966 889,407
O
peratin
g
loss
................................
(1,183,343) (918,320) (737,967)
O
t
h
er
i
ncome (expense):
I
nterest
i
ncome
..............................
9
,
691 18
,
569 65
,
736
I
nterest ex
p
ens
e
.............................
(69,468) (192,
5
88) (192,624)
O
t
h
er
i
ncome (expense), ne
t
.
...................
(
10,014
)(
89,415
)(
36,304
)
T
ota
l
ot
h
er
i
ncome (expense), net ..............
(6
9,791
)(
2
6
3,434
)(
1
6
3,192
)
Loss
b
e
f
ore
i
ncome taxes
........................
(1,253,134) (1,181,754) (901,159)
Income tax
p
rovision
.........................
(712) — —
N
et loss
.....................................
(1,2
5
3,846) (1,181,7
5
4) (901,1
5
9)
L
ess: non-contro
lli
ng
i
nterests
i
n net
l
oss o
f
c
onso
lid
ate
d
su
b
s
idi
ar
i
es
.....................
9
28
,
2
6
48
6
7
,6
08
66
3
,
098
N
et loss attributable to Clearwire Cor
p
oration ......... $ (325,582) $ (314,146) $(238,061
)
N
et
l
oss attr
ib
uta
bl
etoC
l
earw
i
re Cor
p
orat
i
on
p
er
Cl
ass A
C
ommon
Sh
are:
B
as
i
c
.
....................................
$
(1.72) $ (1.62) $ (1.22)
D
il
ute
d
.
...................................
$
(
1.74
)$ (
1.73
)$ (
1.28
)
We
i
g
h
te
d
average C
l
ass A Common S
h
ares outstan
di
ng
:
B
as
i
c
.....................................
194,
6
9
6
194,484 194,48
4
D
il
ute
d
....................................
741,0
7
1
7
23,30
77
23,30
7
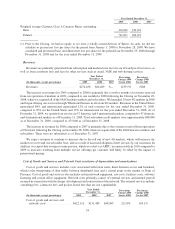
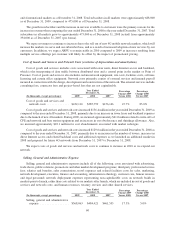
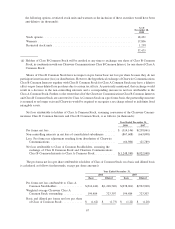
Reve
nu
es
R
evenues are pr
i
mar
il
y generate
df
rom su
b
scr
i
pt
i
on an
d
mo
d
em
l
ease
f
ees
f
or our 4G an
d
pre-4G serv
i
ces, a
s
well as from activation fees and fees for other services such as email, VoIP, and web hostin
g
services
.
(
In thousands, except percentages) 2009 2008 200
7
P
ercenta
g
e
C
han
g
e 2009
V
ersus
2008
P
ercenta
ge
C
han
g
e 2008
V
ersus
200
7
Year Ende
d
December
31,
R
evenues
...................
$
274,458 $230,646 $151,440 19.0% 52.3
%
T
he increase in revenues for 2009 compared to 2008 is primaril
y
due to the addition of 10 new 4G markets in
2
009 and the offering our services through Wholesale Partners in all of our 4G markets. Revenues in the United
S
tates represente
d
88% an
di
nternat
i
ona
l
represente
d
12% o
f
tota
l
revenues
f
or t
h
e
y
ear en
d
e
d
Decem
b
er 31, 2009
,
c
ompared to 84% for the United States and 1
6
% for international for the
y
ear ended December 31, 2008. As of
D
ecember 31, 2009, we o
p
erated our services in
5
7 domestic and 4 international markets, com
p
ared to 47 domestic
59