Clearwire 2009 Annual Report Download - page 72
Download and view the complete annual report
Please find page 72 of the 2009 Clearwire annual report below. You can navigate through the pages in the report by either clicking on the pages listed below, or by using the keyword search tool below to find specific information within the annual report.-
 1
1 -
2
-
3
-
4
-
5
-
6
-
7
-
8
-
9
-
10
-
11
-
12
-
13
-
14
-
15
-
16
-
17
-
18
-
19
-
20
-
21
-
22
-
23
-
24
-
25
-
26
-
27
-
28
-
29
-
30
-
31
-
32
-
33
-
34
-
35
-
36
-
37
-
38
-
39
-
40
-
41
-
42
-
43
-
44
-
45
-
46
-
47
-
48
-
49
-
50
-
51
-
52
-
53
-
54
-
55
-
56
-
57
-
58
-
59
-
60
-
61
-
 62
62 -
 63
63 -
 64
64 -
 65
65 -
 66
66 -
 67
67 -
 68
68 -
 69
69 -
 70
70 -
 71
71 -
 72
72 -
 73
73 -
 74
74 -
 75
75 -
 76
76 -
 77
77 -
 78
78 -
 79
79 -
 80
80 -
 81
81 -
 82
82 -
83
-
84
-
85
-
86
-
87
-
88
-
89
-
90
-
91
-
92
-
93
-
94
-
95
-
96
-
97
-
98
-
99
-
100
-
101
-
102
-
103
-
104
-
105
-
106
-
107
-
108
-
109
-
110
-
111
-
112
-
113
-
114
-
115
-
116
-
117
-
118
-
119
-
120
-
121
-
122
-
123
-
124
-
125
-
126
-
127
-
128
-
129
-
130
-
131
-
132
-
133
-
134
-
135
-
136
-
137
-
138
-
139
-
140
-
141
-
142
-
143
-
144
-
145
-
146
 |
 |

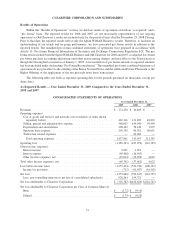
I
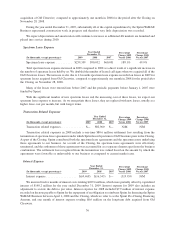
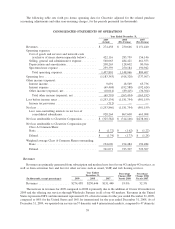
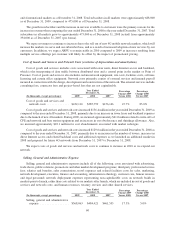
nterest Ex
p
ens
e
(
In thousands, except percentages
)
2009 2008 200
7
P
ercenta
g
e
C
han
g
e 2009
Versus
2008
P
ercenta
ge
C
han
g
e 2008
Versus
200
7
Y
ea
rEn
ded
December
31,
I
nterest ex
p
ens
e
.............
$(69,468) $(192,588) $(192,624) 63.9% N/
M
We incurred twelve months of interest costs totalin
g$
209.6 million, which were partiall
y
offset b
y
capitalized
interest of $140.2 million for the
y
ear ended December 31, 2009. Interest expense for 2009 also includes an
ad
j
ustment to accrete the debt to par value. Interest expense decreased in 2009 when compared to 2008 and 2007, as
more
i
nterest expense
i
n 2009 was cap
i
ta
li
ze
d
re
fl
ect
i
ng t
h
e
i
ncrease
i
n our cap
i
ta
l
expen
di
tures assoc
i
ate
d
w
i
t
h
t
he
increase in the build-out of our network.
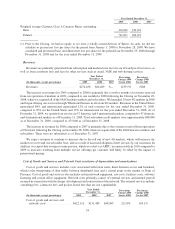
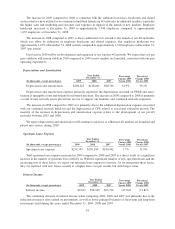
Ot
h
er Income (Ex
p
ense), Ne
t
(
In thousands, except percenta
g
es
)
2009 2008 2007
P
ercenta
g
e
Change 2009
Versus 2008
P
ercenta
ge
C
hange 2008
Versus 2007
Y
ear Ended
D
ecember
31,
O
ther-than-temporary impairmen
t
l
oss on in
v
estments
.
.........
.
$(
10,015
)$(
78,447
)$(
35,020
)
87.2%
(
124.0
)
%
L
oss on undesi
g
nated swa
p
con
t
rac
t
s
,
ne
t
..............
.
(
6,976
)(
7,008
)
—0.
5
% N/M
Gain on debt extin
g
uishment
......
8,2
5
2 — — N/M N/M
Other
.......................
(1,27
5
) (3,960) (1,284) 67.8% (208.4)%
Tota
l
.......................
$(10,014) $(89,415) $(36,304) 88.8% (146.3)%
Ot
h
er
i
ncome (expense)
d
ecrease
di
n 2009 compare
d
to 2008,
b
ecause we recor
d
e
d
an ot
h
er-t
h
an-temporar
y
impairment loss of only
$
10.0 million on our auction rate securities during 2009 compared to an other-than-tem
-
porar
y
impairment loss of
$
78.4 million related to these securities durin
g
2008. Durin
g
2007 we recorded a
n
o
ther-than-temporar
y
impairment loss of onl
y
$35.0 million related to our auction rate securities
.
During November 2009, we recorded a gain of
$
8.3 million in connection with the retirement of our Senior
T
erm Loan Fac
ili
t
y.
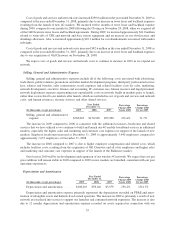
N
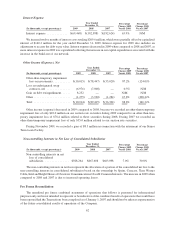
on-contro
ll
ing Interests in Net Loss o
f
Conso
l
i
d
ate
d
Su
b
si
d
iarie
s
(
In thousands, except percentages
)
2009 2008 200
7
P
ercenta
g
e
Chan
g
e 2009
V
ersus
2008
P
ercenta
ge
C
han
g
e 2008
V
ersus
200
7
Year Ende
d
December
31,
Non-controllin
g
interests in ne
t
loss o
f
co
n
so
li
dated
subs
i
d
i
a
ri
es
...............
.
$
928
,
264
$
867
,
608
$
663
,
098 7.0% 30.8
%
T
he non-controllin
g
interests in net loss represent the allocation of a portion of the consolidated net loss to the
n
on-contro
lli
ng
i
nterests
i
n conso
lid
ate
d
su
b
s
idi
ar
i
es
b
ase
d
on t
h
e owners
hi
p
b
y Spr
i
nt, Comcast, T
i
me Warner
Ca
bl
e, Inte
l
an
d
Br
i
g
h
t House o
f
C
l
earw
i
re Commun
i
cat
i
ons C
l
ass B Common Interests. T
h
e
i
ncrease
i
n 2009 w
h
en
c
ompared to 2008 and 2007 is due to increased operatin
g
losses.
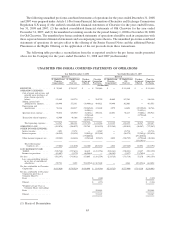
P
r
o
F
o
rm
a
R
eco
n
ci
l
ia
t
ion
T
he unaudited
p
ro forma combined statements of o
p
erations that follows is
p
resented for informational
p
urposes on
ly
an
di
s not
i
nten
d
e
d
to represent or
b
e
i
n
di
cat
i
ve o
f
t
h
e com
bi
ne
d
resu
l
ts o
f
operat
i
ons t
h
at wou
ld h
ave
b
een reporte
dh
a
d
t
h
e Transact
i
ons
b
een comp
l
ete
d
as o
f
Januar
y
1, 2007 an
d
s
h
ou
ld
not
b
eta
k
en as representat
i
ve
of the future consolidated results of operations of the Compan
y
.
6
2