Clearwire 2009 Annual Report Download - page 120
Download and view the complete annual report
Please find page 120 of the 2009 Clearwire annual report below. You can navigate through the pages in the report by either clicking on the pages listed below, or by using the keyword search tool below to find specific information within the annual report.-
 1
1 -
2
-
3
-
4
-
5
-
6
-
7
-
8
-
9
-
10
-
11
-
12
-
13
-
14
-
15
-
16
-
17
-
18
-
19
-
20
-
21
-
22
-
23
-
24
-
25
-
26
-
27
-
28
-
29
-
30
-
31
-
32
-
33
-
34
-
35
-
36
-
37
-
38
-
39
-
40
-
41
-
42
-
43
-
44
-
45
-
46
-
47
-
48
-
49
-
50
-
51
-
52
-
53
-
54
-
55
-
56
-
57
-
58
-
59
-
60
-
61
-
62
-
63
-
64
-
65
-
66
-
67
-
68
-
69
-
70
-
71
-
72
-
73
-
74
-
75
-
76
-
77
-
78
-
79
-
80
-
81
-
82
-
83
-
84
-
85
-
86
-
87
-
88
-
89
-
90
-
91
-
92
-
93
-
94
-
95
-
96
-
97
-
98
-
99
-
100
-
101
-
102
-
103
-
104
-
105
-
106
-
107
-
108
-
109
-
 110
110 -
 111
111 -
 112
112 -
 113
113 -
 114
114 -
 115
115 -
 116
116 -
 117
117 -
 118
118 -
 119
119 -
 120
120 -
 121
121 -
 122
122 -
 123
123 -
 124
124 -
 125
125 -
 126
126 -
 127
127 -
 128
128 -
 129
129 -
 130
130 -
131
-
132
-
133
-
134
-
135
-
136
-
137
-
138
-
139
-
140
-
141
-
142
-
143
-
144
-
145
-
146
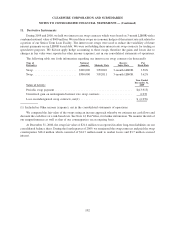
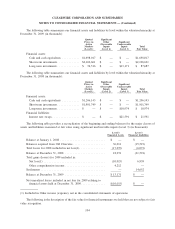
 |
 |

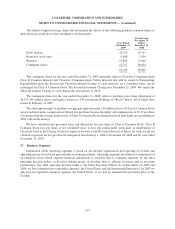
Th
e
f
a
i
rva
l
ue o
f
eac
h
opt
i
on grant
i
s est
i
mate
d
on t
h
e
d
ate o
f
grant us
i
ng t
h
eB
l
ac
k
-Sc
h
o
l
es opt
i
on pr
i
c
i
ng
m
o
d
e
l
us
i
ng t
h
e
f
o
ll
ow
i
ng assumpt
i
ons
f
or t
h
e years en
d
e
d
Decem
b
er 31, 2009 an
d
2008
:
2009 2008
Year Ended December
31
,
Expected volatility ..................................
.
63.3
5
%-67.6
5
% 66.
5
2
%
Expected dividend
y
iel
d
...............................
—
—
Expected life (in
y
ears
)
...............................
4.7
5
- 6.2
5
4.7
5
Risk
-
f
r
ee i
n
te
r
est
r
ate
.................................
1.3
6
%-2.
9
8% 1.
9
3
%
We
igh
te
d
avera
g
e
f
a
i
rva
l
ue per opt
i
on at
g
rant
d
ate
..........
$
2.63
$
2.2
4
T
he fair value of option
g
rants in 2009 was $18.6 million. In addition to options issued in exchan
g
e as part of
t
he Transactions, the fair value of option grants during 2008 was
$
954,000. The total fair value of options vested
durin
g
the
y
ears ended December 31, 2009 and 2008 was $5.8 million and $815,000, respectivel
y
. The tota
l
unreco
g
nized share-based compensation costs related to non-vested stock options outstandin
g
at December 31
,
2
009 was approximately
$
11.5 million and is expected to be recognized over a weighted average period of
approx
i
mate
ly
1.7
y
ears.
For t
h
e years en
d
e
d
Decem
b
er 31, 2009 an
d
2008, our
f
or
f
e
i
ture rate use
di
nt
h
eca
l
cu
l
at
i
on o
f
stoc
k
opt
i
on
expense is 12.
66
%
.
Restricte
d
Stoc
k
Units
I
n connection with the Transactions
,
all Old Clearwire restricted stock units
,
which we refer to as RSUs
,
issued
an
d
outstan
di
n
g
at t
h
eC
l
os
i
n
g
were exc
h
an
g
e
d
on a one-
f
or-one
b
as
i
s
f
or RSUs w
i
t
h
equ
i
va
l
ent terms. Fo
ll
ow
i
n
g
t
he Closin
g
,we
g
ranted RSUs to certain officers and emplo
y
ees under the 2008 Plan. All RSUs vest over a four-
y
ear
p
eriod. The fair value of our RSUs is based on the
g
rant-date fair market value of the common stock, which equal
s
th
e grant
d
ate mar
k
et pr
i
ce
.
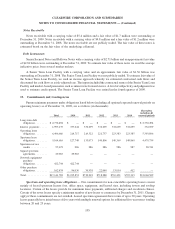
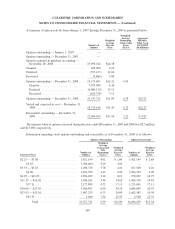
A
summary of the RSU activity for the years ended December 31, 2009 and 2008 is presented below:
Number o
f
R
S
U’
s
Wei
g
hted-
A
verage
G
rant Pric
e
R
estr
i
cte
d
stoc
k
un
i
ts outstan
di
ng — January 1, 200
7
.
...............
—
R
estricted stock units outstanding — December 31, 2007
.
............
—
R
estricted stock units acquired in purchase accountin
g
— November 28,
2008
..................................................
3
,
216
,
500 $13.19
Granted
................................................
716,000 4.10
Fo
rf
e
i
ted
...............................................
(43
,
000)
—
Re
l
ease
d
...............................................
(
508,098) 5.18
C
ance
ll
e
d
..............................................
(108
,777
)
—
R
estr
i
cte
d
stoc
k
un
i
ts outstan
di
ng — Decem
b
er 31, 200
8
.
...........
.
3
,
272
,
625
$
13.1
9
G
ranted ................................................ 10
,
938
,
677 4.3
9
Fo
rf
e
i
ted
...............................................
(
1,217,8
5
7
)5
.1
7
R
e
l
eased
...............................................
(1,140,2
5
1) 6.9
5
C
ancelle
d
..............................................
——
R
estr
i
cte
d
stoc
k
un
i
ts outstan
di
n
g
— Decem
b
er 31, 2009
.............
11
,
853
,
194
$
4.6
0
110
CLEARWIRE CORPORATION AND SUBSIDIARIE
S
N
OTES TO CONSOLIDATED FINANCIAL STATEMENTS —
(
Continued
)