Clearwire 2009 Annual Report Download - page 65
Download and view the complete annual report
Please find page 65 of the 2009 Clearwire annual report below. You can navigate through the pages in the report by either clicking on the pages listed below, or by using the keyword search tool below to find specific information within the annual report.-
 1
1 -
2
-
3
-
4
-
5
-
6
-
7
-
8
-
9
-
10
-
11
-
12
-
13
-
14
-
15
-
16
-
17
-
18
-
19
-
20
-
21
-
22
-
23
-
24
-
25
-
26
-
27
-
28
-
29
-
30
-
31
-
32
-
33
-
34
-
35
-
36
-
37
-
38
-
39
-
40
-
41
-
42
-
43
-
44
-
45
-
46
-
47
-
48
-
49
-
50
-
51
-
52
-
53
-
54
-
 55
55 -
 56
56 -
 57
57 -
 58
58 -
 59
59 -
 60
60 -
 61
61 -
 62
62 -
 63
63 -
 64
64 -
 65
65 -
 66
66 -
 67
67 -
 68
68 -
 69
69 -
 70
70 -
 71
71 -
 72
72 -
 73
73 -
 74
74 -
 75
75 -
76
-
77
-
78
-
79
-
80
-
81
-
82
-
83
-
84
-
85
-
86
-
87
-
88
-
89
-
90
-
91
-
92
-
93
-
94
-
95
-
96
-
97
-
98
-
99
-
100
-
101
-
102
-
103
-
104
-
105
-
106
-
107
-
108
-
109
-
110
-
111
-
112
-
113
-
114
-
115
-
116
-
117
-
118
-
119
-
120
-
121
-
122
-
123
-
124
-
125
-
126
-
127
-
128
-
129
-
130
-
131
-
132
-
133
-
134
-
135
-
136
-
137
-
138
-
139
-
140
-
141
-
142
-
143
-
144
-
145
-
146
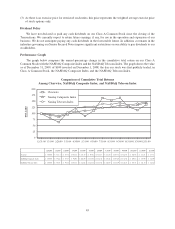
 |
 |

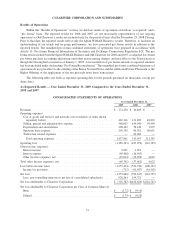
C
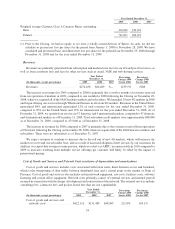
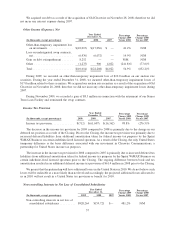
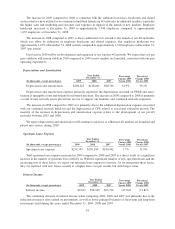
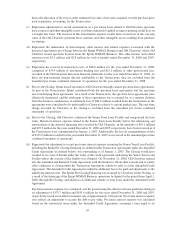
ost of goods and services and network costs increased
$
290.6 million in the year ended December 31, 2009 a
s
c
ompared to the
y
ear ended December 31, 2008, primaril
y
due to an increase in tower lease and backhaul expenses
r
esulting from the launch of new 4G markets. We incurred twelve months of tower lease and backhaul expens
e
d
ur
i
ng 2009, compare
d
to one mont
hf
or 2008
f
o
ll
ow
i
ng t
h
eC
l
os
i
ng on Novem
b
er 28, 2008, w
h
en we acqu
i
re
d
a
ll
of the Old Clearwire tower leases and backhaul a
g
reements. Durin
g
2009, we incurred approximatel
y
$41.0 million
r
e
l
ate
d
to wr
i
te-o
ff
so
f
CPE an
d
networ
k
an
db
ase stat
i
on equ
i
pment an
d
an
i
ncrease
i
n our o
b
so
l
escence an
d
s
hrinkage allowance. Also, we incurred approximately
$
10.1 million for cost abandonments associated with marke
t
r
e
d
es
ig
ns
.
C
ost of
g
oods and services and network costs increased $82.6 million in the
y
ear ended December 31, 2008 a
s
c
ompare
d
to t
h
e year en
d
e
d
Decem
b
er 31, 2007, pr
i
mar
il
y
d
ue to an
i
ncrease
i
n tower
l
ease an
db
ac
kh
au
l
expenses
due to our ac
q
uisition of Old Clearwire on November 28, 2008.
We expect costs of
g
oods and services and network costs to continue to increase in 2010 as we expand our
n
etwork.
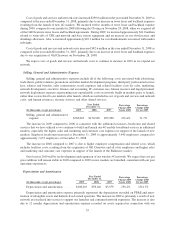
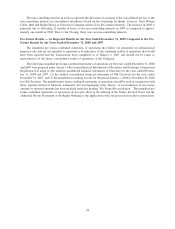
Se
ll
ing, Genera
l
an
d
A
d
ministrative Ex
p
ens
e
Se
lli
n
g
,
g
enera
l
an
d
a
d
m
i
n
i
strat
i
ve expenses
i
nc
l
u
d
ea
ll
o
f
t
h
e
f
o
ll
ow
i
n
g
: costs assoc
i
ate
d
w
i
t
h
a
d
vert
i
s
i
n
g,
t
rade shows, public relations, promotions and other market development programs; third-party professional service
fees; salaries and benefits, sales commissions, travel expenses and related facilities costs for sales, marketing,
n
etwor
kd
eve
l
opment, execut
i
ve,
fi
nance an
d
account
i
n
g
, IT, customer care,
h
uman resource an
dl
e
g
a
l
personne
l;
n
etwork deplo
y
ment expenses representin
g
non-capitalizable costs on network builds in markets prior to launch,
r
ather than costs related to our markets after launch, which are included in cost of
g
oods and services and network
c
osts; an
dh
uman resources, treasury serv
i
ces an
d
ot
h
er s
h
are
d
serv
i
ces
.
(
In thousands, except percentages
)
2009 2008 2007
P
ercenta
g
e
Chan
g
e 2009
Versus
2008
P
ercenta
ge
C
han
g
e 2008
Versus
200
7
Y
ear Ended
D
ecember
31,
Selling, general and administrativ
e
ex
p
ens
e
...................
$
568
,
063
$
150
,
940
$
99
,
490 276.4% 51.7
%
Th
e
i
ncrease
i
n 2009 compare
d
to 2008
i
s cons
i
stent w
i
t
h
t
h
ea
ddi
t
i
ona
l
resources,
h
ea
d
count an
d
s
h
are
d
s
ervices that we have utilized as we continue to build and launch our 4G mobile broadband services in additiona
l
m
arkets, especiall
y
the hi
g
her sales and marketin
g
and customer care expenses in support of the launch of new
m
ar
k
ets. Emp
l
oyee
h
ea
d
count
i
ncrease
d
at Decem
b
er 31, 2009 to approx
i
mate
l
y 3,440 emp
l
oyees compare
d
t
o
approximatel
y
1,635 emplo
y
ees at December 31, 2008
.
T
he increase in 2008 compared to 2007 is due to hi
g
her emplo
y
ee compensation and related costs, which
i
ncludes facilities costs, resultin
g
from the acquisition of Old Clearwire and all of its emplo
y
ees and hi
g
her sales
an
d
mar
k
et
i
ng an
d
customer care expenses
i
n support o
f
t
h
e
l
aunc
h
o
f
t
h
eBa
l
t
i
more mar
k
et.
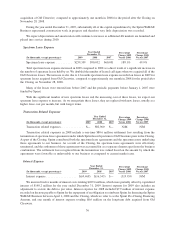
O
ur
f
ocus
i
n 2010 w
ill b
eon
d
eve
l
o
p
ment an
d
ex
p
ans
i
on o
f
our w
i
re
l
ess 4G networ
k
.Weex
p
ect t
h
at cost
p
e
r
gross addition will remain stable in 2010 compared to 2009 as new markets are launched, consistent with our pas
t
operat
i
n
g
exper
i
ences.
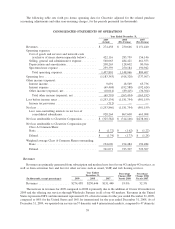
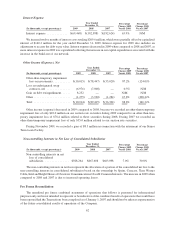
Depreciation and Amortizatio
n
(
In thousands, except percentages
)
2009 2008 2007
P
ercenta
g
e
C
han
g
e 2009
V
ersus
2008
P
ercenta
ge
C
han
g
e 2008
V
ersus
200
7
Yea
rEn
ded
December
31,
D
e
p
reciation and amortizatio
n
......
$
208,263 $58,146 $3,979 258.2% 1361.3
%
D
eprec
i
at
i
on an
d
amort
i
zat
i
on expense pr
i
mar
il
y represents t
h
e
d
eprec
i
at
i
on recor
d
e
d
on PP&E an
d
amor
-
ti
zat
i
on o
fi
ntan
gibl
e assets an
dd
e
fi
n
i
te-
li
ve
d
owne
d
spectrum. T
h
e
i
ncrease
i
n 2009
i
spr
i
mar
ily
a resu
l
to
f
ne
w
n
etwor
k
assets
pl
ace
di
nto serv
i
ce to su
pp
ort our
l
aunc
h
es an
d
cont
i
nue
d
networ
k
ex
p
ans
i
on. T
h
e
i
ncrease
i
sa
l
so
due to 12 months de
p
reciation and amortization ex
p
ense recorded on assets ac
q
uired in connection with our
55