Symantec 2002 Annual Report Download - page 98
Download and view the complete annual report
Please find page 98 of the 2002 Symantec annual report below. You can navigate through the pages in the report by either clicking on the pages listed below, or by using the keyword search tool below to find specific information within the annual report.-
 1
1 -
2
-
3
-
4
-
5
-
6
-
7
-
8
-
9
-
10
-
11
-
12
-
13
-
14
-
15
-
16
-
17
-
18
-
19
-
20
-
21
-
22
-
23
-
24
-
25
-
26
-
27
-
28
-
29
-
30
-
31
-
32
-
33
-
34
-
35
-
36
-
37
-
38
-
39
-
40
-
41
-
42
-
43
-
44
-
45
-
46
-
47
-
48
-
49
-
50
-
51
-
52
-
53
-
54
-
55
-
56
-
57
-
58
-
59
-
60
-
61
-
62
-
63
-
64
-
65
-
66
-
67
-
68
-
69
-
70
-
71
-
72
-
73
-
74
-
75
-
76
-
77
-
78
-
79
-
80
-
81
-
82
-
83
-
84
-
85
-
86
-
87
-
 88
88 -
 89
89 -
 90
90 -
 91
91 -
 92
92 -
 93
93 -
 94
94 -
 95
95 -
 96
96 -
 97
97 -
 98
98 -
 99
99 -
 100
100 -
 101
101 -
 102
102 -
 103
103 -
 104
104 -
 105
105 -
 106
106 -
 107
107 -
 108
108 -
109
 |
 |

SYMANTEC CORPORATION
NOTES TO CONSOLIDATED FINANCIAL STATEMENTS Ì (Continued)
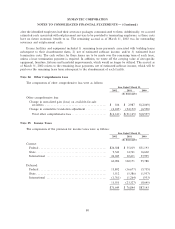
We elected to follow APB No. 25, Accounting for Stock Issued to Employees, in accounting for our
employee stock options because, as discussed below, the alternative fair value accounting provided for under
SFAS No. 123, Accounting for Stock-Based Compensation, requires the use of option valuation models that
were not developed for use in valuing employee stock options. Under APB No. 25, because the exercise price
of our employee stock options generally equals the market price of the underlying stock on the date of grant,
no compensation expense is recognized in our consolidated Ñnancial statements.
Pro forma information regarding net income (loss) and net income (loss) per share is required by SFAS
No. 123. This information is required to be determined as if we had accounted for our employee stock options,
including shares issued under the Employee Stock Purchase Plan, collectively called ""options'', granted
subsequent to March 31, 1995 under the fair value method of that statement. The fair value of options granted
during Ñscal 2002, 2001 and 2000 reported below has been estimated at the date of grant using the Black-
Scholes option-pricing model assuming no expected dividends and the following weighted average
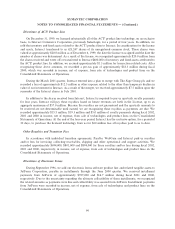
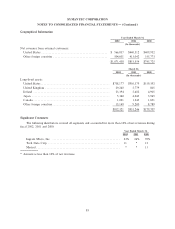
assumptions:
Employee Stock Employee Stock
Options Purchase Plans
2002 2001 2000 2002 2001 2000
Expected life (years)ÏÏÏÏÏÏÏÏÏÏÏÏÏÏÏÏÏÏÏÏÏÏÏÏÏÏÏÏÏÏÏÏÏÏÏ 5.62 5.01 4.99 0.50 0.50 0.50
Expected volatility ÏÏÏÏÏÏÏÏÏÏÏÏÏÏÏÏÏÏÏÏÏÏÏÏÏÏÏÏÏÏÏÏÏÏÏÏÏ 0.76 0.71 0.65 0.80 0.84 0.68
Risk free interest rate ÏÏÏÏÏÏÏÏÏÏÏÏÏÏÏÏÏÏÏÏÏÏÏÏÏÏÏÏÏÏÏÏÏÏ 4.60% 4.50% 6.50% 2.70% 6.00% 5.20%
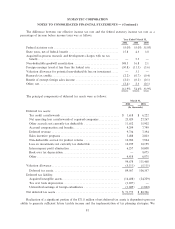
The Black-Scholes option valuation model was developed for use in estimating the fair value of traded
options that have no vesting restrictions and are fully transferable. In addition, option valuation models require
the input of highly subjective assumptions, including the expected stock price volatility. Because our options
have characteristics signiÑcantly diÅerent from those of traded options and because changes in the subjective
input assumptions can materially aÅect the fair value estimate, in our opinion, the existing models do not
necessarily provide a reliable single measure of the fair value of our options.
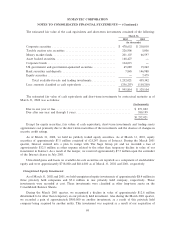
The weighted average estimated fair values of employee stock options granted during Ñscal 2002, 2001
and 2000 were approximately $20.66, $12.70 and $13.62 per share, respectively. The weighted average
estimated fair value of employee stock purchase rights granted under the Employee Stock Purchase Plan
during Ñscal 2002, 2001 and 2000 were approximately $14.56, $10.53 and $10.03, respectively.
For purposes of pro forma disclosure, the estimated fair value of the options was amortized to expense
over the options' vesting period, for employee stock options, and the six-month purchase period, for stock
purchases under the Employee Stock Purchase Plan. Options assumed as the result of our acquisition of
AXENT were not included in the estimated fair value. Shares purchased through the AXENT Purchase Plan
subsequent to the closing date of the AXENT acquisition were included in the estimated fair value and were
included in the pro forma information as follows:
Year Ended March 31,
2002 2001 2000
(In thousands, except per share data)
Net income (loss) Ì basic Ì pro forma ÏÏÏÏÏÏÏÏÏÏÏÏÏÏÏÏÏÏÏÏÏÏÏÏÏ $(107,292) $7,256 $137,829
Net income (loss) Ì diluted Ì pro forma ÏÏÏÏÏÏÏÏÏÏÏÏÏÏÏÏÏÏÏÏÏÏÏ (107,292) 7,256 137,829
Net income (loss) per share Ì basic Ì pro formaÏÏÏÏÏÏÏÏÏÏÏÏÏÏÏÏÏ (0.75) 0.06 1.25
Net income (loss) per share Ì diluted Ì pro forma ÏÏÏÏÏÏÏÏÏÏÏÏÏÏÏ (0.75) 0.06 1.16
The eÅects on pro forma disclosures of applying SFAS No. 123 are not likely to be representative of the
eÅects on pro forma disclosures of future years.
76