Symantec 2002 Annual Report Download - page 44
Download and view the complete annual report
Please find page 44 of the 2002 Symantec annual report below. You can navigate through the pages in the report by either clicking on the pages listed below, or by using the keyword search tool below to find specific information within the annual report.-
 1
1 -
2
-
3
-
4
-
5
-
6
-
7
-
8
-
9
-
10
-
11
-
12
-
13
-
14
-
15
-
16
-
17
-
18
-
19
-
20
-
21
-
22
-
23
-
24
-
25
-
26
-
27
-
28
-
29
-
30
-
31
-
32
-
33
-
 34
34 -
 35
35 -
 36
36 -
 37
37 -
 38
38 -
 39
39 -
 40
40 -
 41
41 -
 42
42 -
 43
43 -
 44
44 -
 45
45 -
 46
46 -
 47
47 -
 48
48 -
 49
49 -
 50
50 -
 51
51 -
 52
52 -
 53
53 -
 54
54 -
55
-
56
-
57
-
58
-
59
-
60
-
61
-
62
-
63
-
64
-
65
-
66
-
67
-
68
-
69
-
70
-
71
-
72
-
73
-
74
-
75
-
76
-
77
-
78
-
79
-
80
-
81
-
82
-
83
-
84
-
85
-
86
-
87
-
88
-
89
-
90
-
91
-
92
-
93
-
94
-
95
-
96
-
97
-
98
-
99
-
100
-
101
-
102
-
103
-
104
-
105
-
106
-
107
-
108
-
109
 |
 |
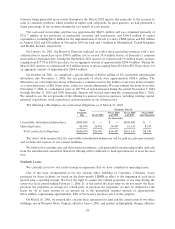
International
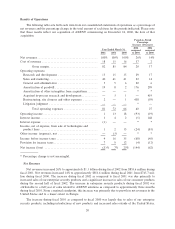
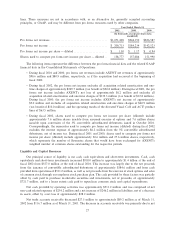
Net revenues outside of the United States represented approximately 47%, 48% and 45% of total net
revenues during Ñscal 2002, 2001 and 2000, respectively. International net revenues increased by $91.6 mil-
lion, or 22%, to approximately $504.6 million during Ñscal 2002 as compared to Ñscal 2001. This increase in
net revenues was the result of increased sales in Europe and Asia, primarily from increased sales of our
enterprise security and consumer products. International revenues increased by $77.3 million, or 23%, to
approximately $413.0 million during Ñscal 2001 as compared to Ñscal 2000. This increase was largely due to
stronger sales in Europe and Japan.
Weakness in international currencies during Ñscal 2002 negatively impacted our international revenue
growth by approximately $14.0 million as compared to the impact of average international currency rates
during Ñscal 2001. The negative impact during Ñscal 2001 as compared to the impact of average international
currency rates during Ñscal 2000 was approximately $43.8 million.
Product Returns
We estimate and record channel deferrals and obsolescence reserves to cover exposures related to product
returns. Product returns principally relate to stock balancing and the replacement of obsolete products, which
are oÅset by orders of equal or greater value for the current versions of the products. The mix of products
returned from our distributors/resellers as compared to products sold to our distributors/resellers does not
impact our gross margin, as our gross margin is materially consistent across our various product families.
Changes in the level of product returns and related product returns provision are generally oÅset by a change
in the level of gross revenue. As a result, the product returns provision did not have a material impact on
reported net revenues in any period presented.
Gross Margin
Gross margin represents net revenues less cost of revenues. Cost of revenues consists primarily of
manufacturing expenses, costs for producing manuals and CDs, packaging costs, royalties paid to third parties
under publishing contracts, costs of consulting services, technical support costs and amortization and write-oÅ
of acquired product rights.
Gross margin was approximately 82%, 85% and 84% of net revenues during Ñscal 2002, 2001 and 2000,
respectively. The decline in gross margin during Ñscal 2002 as compared to Ñscal 2001 was mostly driven by
increased amortization of acquired product rights from our acquisition of AXENT and technical support costs
as a result of an increase in related enterprise sales. In addition, consulting service costs included in costs of
revenue increased along with the related increase in consulting service revenues. This contributed to the
decline in gross margin during Ñscal 2002, as consulting services typically have lower margins than our
products.
Gross margin improved slightly during Ñscal 2001 as compared to Ñscal 2000 due primarily to higher
margins associated with the increase in enterprise related sales and cost savings achieved in reduced packaging
costs.
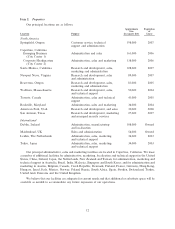
Acquired Product Rights
Acquired product rights are comprised of purchased product rights, technologies and workforce-in-place.
During Ñscal 2001, we recorded approximately $86.2 million in acquired product rights in connection with our
acquisition of AXENT, and during Ñscal 2000, we recorded approximately $11.3 million in acquired product
rights in connection with other acquisitions.
During Ñscal 2002, amortization of acquired product rights totaled approximately $32.2 million, of which
$31.1 million and $1.1 million was recorded in cost of revenues and income (net of expense) from sale of
technologies and product lines, respectively. During Ñscal 2001 and 2000, amortization of acquired product
rights totaled $17.3 million and $9.7 million, respectively, and was recorded in cost of revenues. Acquired
product rights, with the exception of workforce-in-place, will be amortized over the next four years. EÅective
22