Symantec 2002 Annual Report Download - page 43
Download and view the complete annual report
Please find page 43 of the 2002 Symantec annual report below. You can navigate through the pages in the report by either clicking on the pages listed below, or by using the keyword search tool below to find specific information within the annual report.-
 1
1 -
2
-
3
-
4
-
5
-
6
-
7
-
8
-
9
-
10
-
11
-
12
-
13
-
14
-
15
-
16
-
17
-
18
-
19
-
20
-
21
-
22
-
23
-
24
-
25
-
26
-
27
-
28
-
29
-
30
-
31
-
32
-
 33
33 -
 34
34 -
 35
35 -
 36
36 -
 37
37 -
 38
38 -
 39
39 -
 40
40 -
 41
41 -
 42
42 -
 43
43 -
 44
44 -
 45
45 -
 46
46 -
 47
47 -
 48
48 -
 49
49 -
 50
50 -
 51
51 -
 52
52 -
 53
53 -
54
-
55
-
56
-
57
-
58
-
59
-
60
-
61
-
62
-
63
-
64
-
65
-
66
-
67
-
68
-
69
-
70
-
71
-
72
-
73
-
74
-
75
-
76
-
77
-
78
-
79
-
80
-
81
-
82
-
83
-
84
-
85
-
86
-
87
-
88
-
89
-
90
-
91
-
92
-
93
-
94
-
95
-
96
-
97
-
98
-
99
-
100
-
101
-
102
-
103
-
104
-
105
-
106
-
107
-
108
-
109
 |
 |
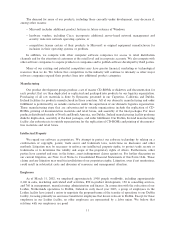
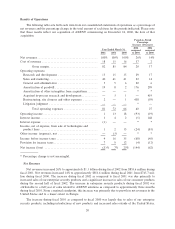
The increase in enterprise security products during Ñscal 2001 was attributable to approximately three months
of sales related to AXENT solutions, as a result of our acquisition of AXENT in December 2000.
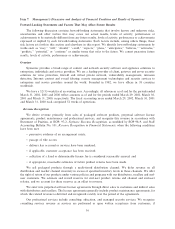
Segments
Enterprise Security
Our Enterprise Security segment revenue comprised approximately 42%, 33% and 22% of total net
revenues during Ñscal 2002, 2001 and 2000, respectively. Net revenues increased $172.1 million, or 61%, to
approximately $454.9 million during Ñscal 2002 from $282.8 million during Ñscal 2001 and increased $116.0
million, or 70%, to $282.8 million during Ñscal 2001 from $166.8 million during Ñscal 2000. The increase
during Ñscal 2002 over Ñscal 2001 was primarily due to our Ñrst full year of sales of intrusion detection,
vulnerability management and Ñrewall product solutions, as a result of our acquisition of AXENT in
December 2000, and in particular, signiÑcant growth in sales of virus protection product solutions.
Enterprise Administration
Our Enterprise Administration segment represented approximately 21%, 27% and 29% of total net
revenues during Ñscal 2002, 2001 and 2000, respectively. Net revenues decreased by approximately $8.1 mil-
lion, or 4%, during Ñscal 2002 as compared to Ñscal 2001 due to a decline in sales of our pcAnywhere product,
partially oÅset by growth in sales of our Ghost Corporate Edition product. The decline in our pcAnywhere
product was the result of a decrease in small business and home oÇce sales, which was partially oÅset by an
increase in corporate sales.
Net revenues increased by approximately $13.9 million, or 6%, during Ñscal 2001 as compared to Ñscal
2000 primarily due to the release of our Ghost Corporate Edition product.
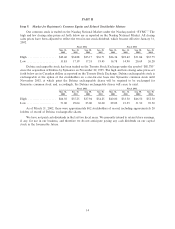
Consumer Products
Our Consumer Products segment represented approximately 35%, 39% and 43% of total net revenues
during Ñscal 2002, 2001 and 2000, respectively. Net revenues increased by approximately $45.8 million, or
14%, during Ñscal 2002 as compared to Ñscal 2001. This increase was primarily related to an increase in sales
of our Norton AntiVirus and Norton Internet Security products, mostly as a result of strong consumer and
small business spending, and an increase in the renewal subscription pricing of our antivirus products. This
increase was oÅset by a decline in sales of our Winfax and Macintosh products. In particular, we experienced a
signiÑcant increase in sales of consumer products over the second half of Ñscal 2002, and we do not expect
sales to continue to grow at the same rate going forward. Over the last six years, our sales to individual
consumers, home oÇces and small businesses have been seasonal, with higher sales generally in our December
and March quarters.
Net revenues increased by approximately $11.3 million, or 4%, during Ñscal 2001 as compared to Ñscal
2000. This increase was primarily due to the increase in customer focus on protecting their home computers
from Internet related attacks. This factor contributed to growth in sales of our Norton Internet Security
product, which was introduced in the March 2000 quarter.
Services and Other
Our Services and Other segments represented approximately 2%, 1% and 6% of total net revenues during
Ñscal 2002, 2001 and 2000, respectively. Net revenues increased in absolute dollars during Ñscal 2002 as
compared to Ñscal 2001, due primarily to our services segment as the demand for our consulting services
increased. Net revenues decreased in absolute dollars during Ñscal 2001 as compared to Ñscal 2000, due to our
divestiture of the Visual Cafπe and ACT! product lines in December 1999, which is included in the Other
segment.
21