Symantec 2002 Annual Report Download - page 2
Download and view the complete annual report
Please find page 2 of the 2002 Symantec annual report below. You can navigate through the pages in the report by either clicking on the pages listed below, or by using the keyword search tool below to find specific information within the annual report.-
 1
1 -
 2
2 -
 3
3 -
 4
4 -
 5
5 -
 6
6 -
 7
7 -
 8
8 -
 9
9 -
 10
10 -
 11
11 -
 12
12 -
 13
13 -
14
-
15
-
16
-
17
-
18
-
19
-
20
-
21
-
22
-
23
-
24
-
25
-
26
-
27
-
28
-
29
-
30
-
31
-
32
-
33
-
34
-
35
-
36
-
37
-
38
-
39
-
40
-
41
-
42
-
43
-
44
-
45
-
46
-
47
-
48
-
49
-
50
-
51
-
52
-
53
-
54
-
55
-
56
-
57
-
58
-
59
-
60
-
61
-
62
-
63
-
64
-
65
-
66
-
67
-
68
-
69
-
70
-
71
-
72
-
73
-
74
-
75
-
76
-
77
-
78
-
79
-
80
-
81
-
82
-
83
-
84
-
85
-
86
-
87
-
88
-
89
-
90
-
91
-
92
-
93
-
94
-
95
-
96
-
97
-
98
-
99
-
100
-
101
-
102
-
103
-
104
-
105
-
106
-
107
-
108
-
109
 |
 |
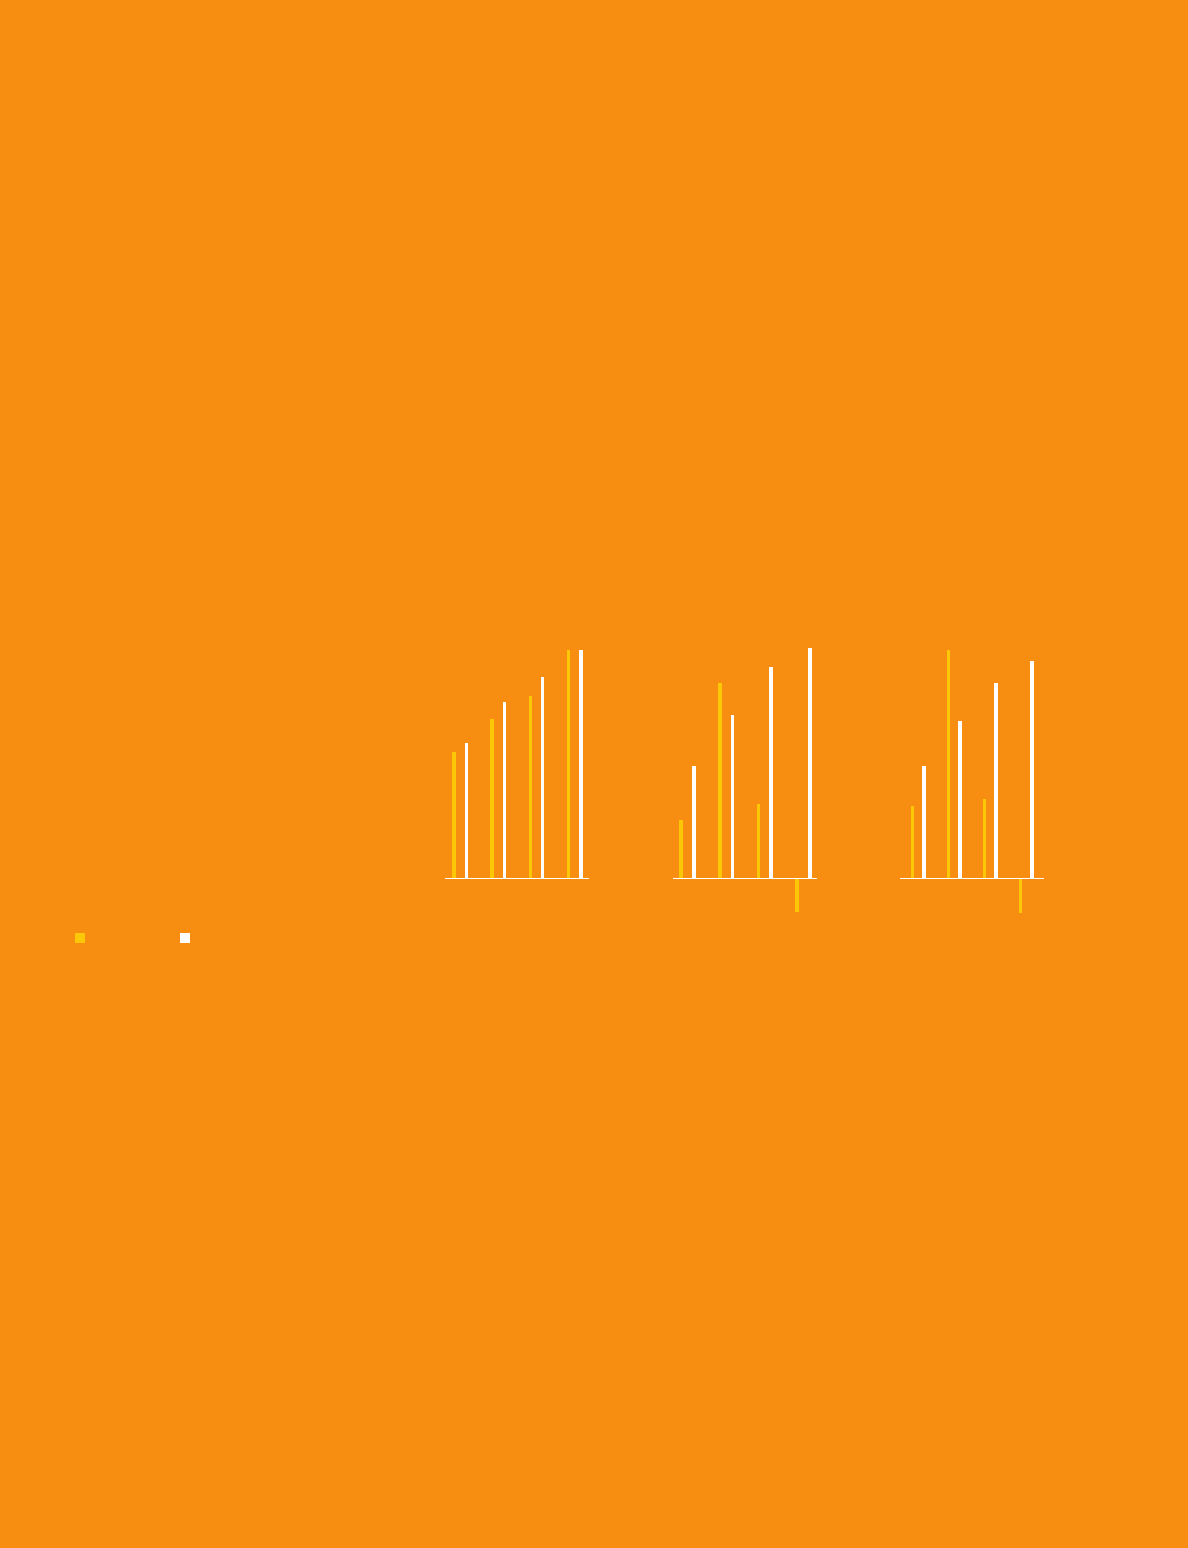
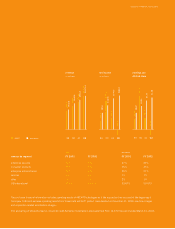
The pro forma financial information includes operating results of AXENT Technologies as if the acquisition had occurred at the beginning of
fiscal year 1999 and excludes operating results from Visual Café and ACT! product lines divested on December 31, 1999, one-time charges
and acquisition-related amortization charges.
This annual report should be read in conjunction with Symantec Corporation’s previously filed Form 10-K for the period ended March 31, 2002.
earnings per
diluted share
($0.20)
$0.43
$1.37
$0.47
$1.30
$0.67
$0.94
$1.17
0299 00 01
($28.2)
$50.2
$170.1
$63.9
$200.7
$97.6
$142.5
$184.2
net income
in millions
0299 00 01
revenue
in millions
$1,071.4
$592.6
$745.7
$853.6
$1,071.4
$632.2
$826.6
$944.2
0299 00 01
GAAP pro forma
revenue by segment FY 2001 FY 2002 FY 2001 FY 2002
enterprise security 33% 42% 37% 42%
consumer products 39% 35% 35% 35%
enterprise administration 27% 21% 25% 21%
services 0% 1% 1% 1%
other 1% 1% 2% 1%
US/international 52/48% 53/47% 53/47% 53/47%
GAAP pro forma
SELECTED FINANCIAL HIGHLIGHTS