Symantec 2002 Annual Report Download - page 49
Download and view the complete annual report
Please find page 49 of the 2002 Symantec annual report below. You can navigate through the pages in the report by either clicking on the pages listed below, or by using the keyword search tool below to find specific information within the annual report.-
 1
1 -
2
-
3
-
4
-
5
-
6
-
7
-
8
-
9
-
10
-
11
-
12
-
13
-
14
-
15
-
16
-
17
-
18
-
19
-
20
-
21
-
22
-
23
-
24
-
25
-
26
-
27
-
28
-
29
-
30
-
31
-
32
-
33
-
34
-
35
-
36
-
37
-
38
-
 39
39 -
 40
40 -
 41
41 -
 42
42 -
 43
43 -
 44
44 -
 45
45 -
 46
46 -
 47
47 -
 48
48 -
 49
49 -
 50
50 -
 51
51 -
 52
52 -
 53
53 -
 54
54 -
 55
55 -
 56
56 -
 57
57 -
 58
58 -
 59
59 -
60
-
61
-
62
-
63
-
64
-
65
-
66
-
67
-
68
-
69
-
70
-
71
-
72
-
73
-
74
-
75
-
76
-
77
-
78
-
79
-
80
-
81
-
82
-
83
-
84
-
85
-
86
-
87
-
88
-
89
-
90
-
91
-
92
-
93
-
94
-
95
-
96
-
97
-
98
-
99
-
100
-
101
-
102
-
103
-
104
-
105
-
106
-
107
-
108
-
109
 |
 |

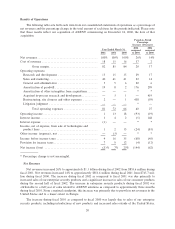
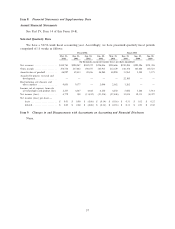
lines. These measures are not in accordance with, or an alternative for, generally accepted accounting
principles, or GAAP, and may be diÅerent from pro forma measures used by other companies.
Year Ended March 31,
2002 2001 2000
(In thousands, except per share data;
unaudited)
Pro forma net revenues ÏÏÏÏÏÏÏÏÏÏÏÏÏÏÏÏÏÏÏÏÏÏÏÏÏÏÏÏÏÏÏÏÏÏÏÏÏÏÏ $1,071,438 $944,150 $826,587
Pro forma net income ÏÏÏÏÏÏÏÏÏÏÏÏÏÏÏÏÏÏÏÏÏÏÏÏÏÏÏÏÏÏÏÏÏÏÏÏÏÏÏÏ $ 200,713 $184,234 $142,523
Pro forma net income per share Ì diluted ÏÏÏÏÏÏÏÏÏÏÏÏÏÏÏÏÏÏÏÏÏÏÏ $ 1.30 $ 1.17 $ 0.94
Shares used to compute pro forma net income per share Ì diluted ÏÏ 158,777 157,084 151,990
The following items represent the diÅerence between the pro forma Ñnancial data and the related GAAP
Ñnancial data in the Consolidated Statements of Operations:
‚ During Ñscal 2001 and 2000, pro forma net revenues include AXENT net revenues of approximately
$90.6 million and $80.9 million, respectively, as if the acquisition had occurred at the beginning of
Ñscal 2000.
‚ During Ñscal 2002, the pro forma net income excludes all acquisition related amortization and one-
time charges of approximately $249.7 million (tax beneÑt of $20.8 million). During Ñscal 2001, the pro
forma net income includes AXENT's net loss of approximately $6.2 million and excludes all
acquisition related amortization and one-time charges of $139.3 million (tax beneÑt of $12.8 million).
During Ñscal 2000, the pro forma net income includes AXENT's net income of approximately
$5.0 million and excludes all acquisition related amortization and one-time charges of $40.9 million
(tax beneÑt of $10.0 million) and the operating results of the divested Visual Cafπe and ACT! product
lines of $63.5 million.
‚ During Ñscal 2002, shares used to compute pro forma net income per share (diluted) include
approximately 7.6 million shares issuable from assumed exercise of options and 7.6 million shares
issuable upon conversion of the 3% convertible subordinated debentures issued in October 2001.
Correspondingly, the numerator used to compute pro forma net income (diluted) during Ñscal 2002
excludes the interest expense of approximately $6.2 million from the 3% convertible subordinated
debentures, net of income tax. During Ñscal 2001 and 2000, shares used to compute pro forma net
income per share (diluted) include approximately 20.6 million and 27.6 million shares, respectively,
which represents the number of Symantec shares that would have been exchanged for AXENT's
weighted number of common shares outstanding for the respective periods.
Liquidity and Capital Resources
Our principal source of liquidity is our cash, cash equivalents and short-term investments. Cash, cash
equivalents and short-term investments increased $818.0 million to approximately $1.4 billion at the end of
Ñscal 2002 from $557.0 million at the end of Ñscal 2001. This increase was largely due to the net proceeds
from the issuance of convertible subordinated debentures of approximately $584.6 million and from cash
provided from operations of $511.2 million, as well as net proceeds from the exercise of stock options and sales
of common stock through our employee stock purchase plan. The cash provided by these factors was partially
oÅset by cash paid to purchase marketable securities and investments, net of proceeds, of approximately
$721.7 million, and to a lesser extent cash paid to repurchase common stock and capital expenditures.
Net cash provided by operating activities was approximately $511.2 million and was comprised of net
non-cash related expenses of $293.2 million and a net increase of $246.2 million in liabilities, net of a decrease
in assets, oÅset by a net loss of approximately $28.2 million.
Net trade accounts receivable decreased $27.5 million to approximately $89.2 million as of March 31,
2002 from $116.7 million as of March 31, 2001. The decrease in accounts receivable was primarily due to net
27