Symantec 2002 Annual Report Download - page 37
Download and view the complete annual report
Please find page 37 of the 2002 Symantec annual report below. You can navigate through the pages in the report by either clicking on the pages listed below, or by using the keyword search tool below to find specific information within the annual report.-
 1
1 -
2
-
3
-
4
-
5
-
6
-
7
-
8
-
9
-
10
-
11
-
12
-
13
-
14
-
15
-
16
-
17
-
18
-
19
-
20
-
21
-
22
-
23
-
24
-
25
-
26
-
 27
27 -
 28
28 -
 29
29 -
 30
30 -
 31
31 -
 32
32 -
 33
33 -
 34
34 -
 35
35 -
 36
36 -
 37
37 -
 38
38 -
 39
39 -
 40
40 -
 41
41 -
 42
42 -
 43
43 -
 44
44 -
 45
45 -
 46
46 -
 47
47 -
48
-
49
-
50
-
51
-
52
-
53
-
54
-
55
-
56
-
57
-
58
-
59
-
60
-
61
-
62
-
63
-
64
-
65
-
66
-
67
-
68
-
69
-
70
-
71
-
72
-
73
-
74
-
75
-
76
-
77
-
78
-
79
-
80
-
81
-
82
-
83
-
84
-
85
-
86
-
87
-
88
-
89
-
90
-
91
-
92
-
93
-
94
-
95
-
96
-
97
-
98
-
99
-
100
-
101
-
102
-
103
-
104
-
105
-
106
-
107
-
108
-
109
 |
 |

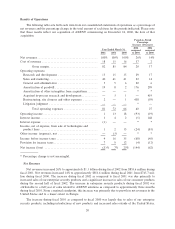
Item 6. Selected Financial Data
The following selected Ñnancial data is qualiÑed in its entirety by and should be read in conjunction with
the more detailed consolidated Ñnancial statements and related notes included elsewhere herein.
During Ñscal 2002, we acquired Lindner & Pelc and Foster-Melliar. During Ñscal 2001, we acquired
AXENT. During Ñscal 2000, we acquired 20/20 Software, L-3 Network Security's operations and URLabs.
Each of these acquisitions was accounted for as a purchase and, accordingly, the operating results of these
businesses have been included in our consolidated Ñnancial statements since their respective dates of
acquisition.
On August 24, 2001, we divested our web access management product line. On December 31, 1999, we
divested our Visual Cafπe and ACT! product lines. These product lines are included in the results of operations
prior to disposition and are included in our Other segment.
Five-Year Summary
Year Ended March 31,
2002 2001 2000 1999 1998
(In thousands, except net income (loss) per share)
Statements of Operations Data:
Net revenuesÏÏÏÏÏÏÏÏÏÏÏÏÏÏÏÏÏÏÏÏÏÏÏÏÏ $1,071,438 $853,554 $745,725 $592,628 $532,940
Amortization of goodwillÏÏÏÏÏÏÏÏÏÏÏÏÏÏÏ 196,806 71,336 17,884 6,175 Ì
Acquired in-process research and
development ÏÏÏÏÏÏÏÏÏÏÏÏÏÏÏÏÏÏÏÏÏÏÏ Ì 22,300 4,300 27,465 Ì
Restructuring, site closures and other
expenses ÏÏÏÏÏÏÏÏÏÏÏÏÏÏÏÏÏÏÏÏÏÏÏÏÏÏ 20,428 3,664 9,018 5,105 Ì
Litigation judgment ÏÏÏÏÏÏÏÏÏÏÏÏÏÏÏÏÏÏÏ 3,055 Ì Ì 5,825 Ì
Operating incomeÏÏÏÏÏÏÏÏÏÏÏÏÏÏÏÏÏÏÏÏÏ 8,041 109,600 135,203 27,841 54,924
Net income (loss) ÏÏÏÏÏÏÏÏÏÏÏÏÏÏÏÏÏÏÏÏ (28,151) 63,936 170,148 50,201 85,089
Net income (loss) per share Ì basic ÏÏÏÏ $ (0.20) $ 0.49 $ 1.47 $ 0.44 $ 0.76
Net income (loss) per share Ì diluted ÏÏÏ $ (0.20) $ 0.47 $ 1.37 $ 0.42 $ 0.71
Shares used to compute net income
(loss) per share Ì basic ÏÏÏÏÏÏÏÏÏÏÏÏÏ 143,604 129,474 115,740 113,202 112,194
Shares used to compute net income
(loss) per share Ì diluted ÏÏÏÏÏÏÏÏÏÏÏ 143,604 136,474 124,428 118,578 120,562
March 31,
2002 2001 2000 1999 1998
(In thousands)
Balance Sheet Data:
Working capitalÏÏÏÏÏÏÏÏÏÏÏÏÏÏÏÏÏÏÏÏÏÏ $ 983,721 $ 369,184 $319,020 $94,036 $175,537
Total assets ÏÏÏÏÏÏÏÏÏÏÏÏÏÏÏÏÏÏÏÏÏÏÏÏÏ 2,502,605 1,791,581 846,027 563,476 476,460
Convertible subordinated debentures ÏÏÏÏ 600,000 Ì Ì Ì Ì
Other long-term obligations, less current
portion ÏÏÏÏÏÏÏÏÏÏÏÏÏÏÏÏÏÏÏÏÏÏÏÏÏÏÏ 3,631 2,363 1,553 1,455 5,951
Stockholders' equity ÏÏÏÏÏÏÏÏÏÏÏÏÏÏÏÏÏÏ 1,319,876 1,376,501 617,957 345,113 317,507
15