Symantec 2002 Annual Report Download - page 59
Download and view the complete annual report
Please find page 59 of the 2002 Symantec annual report below. You can navigate through the pages in the report by either clicking on the pages listed below, or by using the keyword search tool below to find specific information within the annual report.-
 1
1 -
2
-
3
-
4
-
5
-
6
-
7
-
8
-
9
-
10
-
11
-
12
-
13
-
14
-
15
-
16
-
17
-
18
-
19
-
20
-
21
-
22
-
23
-
24
-
25
-
26
-
27
-
28
-
29
-
30
-
31
-
32
-
33
-
34
-
35
-
36
-
37
-
38
-
39
-
40
-
41
-
42
-
43
-
44
-
45
-
46
-
47
-
48
-
 49
49 -
 50
50 -
 51
51 -
 52
52 -
 53
53 -
 54
54 -
 55
55 -
 56
56 -
 57
57 -
 58
58 -
 59
59 -
 60
60 -
 61
61 -
 62
62 -
 63
63 -
 64
64 -
 65
65 -
 66
66 -
 67
67 -
 68
68 -
 69
69 -
70
-
71
-
72
-
73
-
74
-
75
-
76
-
77
-
78
-
79
-
80
-
81
-
82
-
83
-
84
-
85
-
86
-
87
-
88
-
89
-
90
-
91
-
92
-
93
-
94
-
95
-
96
-
97
-
98
-
99
-
100
-
101
-
102
-
103
-
104
-
105
-
106
-
107
-
108
-
109
 |
 |

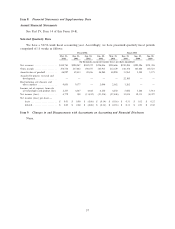
Item 8. Financial Statements and Supplementary Data
Annual Financial Statements
See Part IV, Item 14 of this Form 10-K.
Selected Quarterly Data
We have a 52/53-week Ñscal accounting year. Accordingly, we have presented quarterly Ñscal periods
comprised of 13 weeks as follows:
Fiscal 2002 Fiscal 2001
Mar. 31, Dec. 31, Sep. 30, Jun. 30, Mar. 31, Dec. 31, Sep. 30, Jun. 30,
2002 2001 2001 2001 2001 2000 2000 2000
(In thousands, except net income (loss) per share; unaudited)
Net revenues ÏÏÏÏÏÏÏÏÏÏÏÏÏÏÏÏÏÏÏ $310,783 $290,247 $242,372 $228,036 $250,606 $219,294 $192,296 $191,358
Gross margin ÏÏÏÏÏÏÏÏÏÏÏÏÏÏÏÏÏÏÏ 254,754 237,682 198,477 185,915 212,129 188,356 165,688 163,521
Amortization of goodwill ÏÏÏÏÏÏÏÏÏ 48,997 49,413 49,416 48,980 48,994 11,965 5,202 5,175
Acquired in-process research and
development ÏÏÏÏÏÏÏÏÏÏÏÏÏÏÏÏÏÏ ÌÌÌÌÌ22,300 Ì Ì
Restructuring, site closures and
other expenses ÏÏÏÏÏÏÏÏÏÏÏÏÏÏÏÏ 9,005 9,377 Ì 2,046 2,382 1,282 Ì Ì
Income, net of expense, from sale
of technologies and product lines 2,257 4,387 4,642 4,250 4,250 5,000 5,284 5,914
Net income (loss) ÏÏÏÏÏÏÏÏÏÏÏÏÏÏÏ 4,779 100 (11,812) (21,218) (27,448) 13,874 39,113 38,397
Net income (loss) per share Ì
basic ÏÏÏÏÏÏÏÏÏÏÏÏÏÏÏÏÏÏÏÏÏÏ $ 0.03 $ 0.00 $ (0.08) $ (0.14) $ (0.18) $ 0.11 $ 0.32 $ 0.32
dilutedÏÏÏÏÏÏÏÏÏÏÏÏÏÏÏÏÏÏÏÏÏ $ 0.03 $ 0.00 $ (0.08) $ (0.14) $ (0.18) $ 0.11 $ 0.31 $ 0.30
Item 9. Changes in and Disagreements with Accountants on Accounting and Financial Disclosure
None.
37