Spirit Airlines 2011 Annual Report Download - page 92
Download and view the complete annual report
Please find page 92 of the 2011 Spirit Airlines annual report below. You can navigate through the pages in the report by either clicking on the pages listed below, or by using the keyword search tool below to find specific information within the annual report.-
 1
1 -
2
-
3
-
4
-
5
-
6
-
7
-
8
-
9
-
10
-
11
-
12
-
13
-
14
-
15
-
16
-
17
-
18
-
19
-
20
-
21
-
22
-
23
-
24
-
25
-
26
-
27
-
28
-
29
-
30
-
31
-
32
-
33
-
34
-
35
-
36
-
37
-
38
-
39
-
40
-
41
-
42
-
43
-
44
-
45
-
46
-
47
-
48
-
49
-
50
-
51
-
52
-
53
-
54
-
55
-
56
-
57
-
58
-
59
-
60
-
61
-
62
-
63
-
64
-
65
-
66
-
67
-
68
-
69
-
70
-
71
-
72
-
73
-
74
-
75
-
76
-
77
-
78
-
79
-
80
-
81
-
 82
82 -
 83
83 -
 84
84 -
 85
85 -
 86
86 -
 87
87 -
 88
88 -
 89
89 -
 90
90 -
 91
91 -
 92
92 -
 93
93 -
 94
94 -
 95
95 -
 96
96 -
 97
97 -
 98
98 -
 99
99 -
 100
100 -
 101
101 -
 102
102 -
103
-
104
-
105
-
106
-
107
-
108
-
109
-
110
-
111
-
112
-
113
-
114
-
115
-
116
-
117
-
118
-
119
-
120
-
121
-
122
-
123
-
124
-
125
-
126
-
127
-
128
-
129
-
130
 |
 |

Notes to Financial Statements—(Continued)
upon the simplified method, which represents the average of the vesting term and the contractual term. The risk-
free interest rate is based on U.S.
Treasury yields for securities with terms approximating the expected term of the option. There were no grants of option awards prior to 2010.
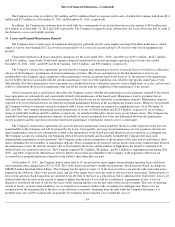
To the extent a market price was not available, the fair value of the Company’s common stock was estimated using a discounted cash flow
analysis and market multiples, based on management’
s estimates of revenue, driven by assumed market growth rates, and estimated costs as well
as appropriate discount rates. These estimates are consistent with the plans and estimates management uses to manage the Company’s business.
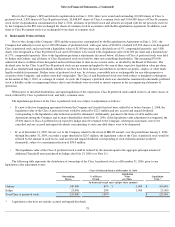
Share-based compensation cost is included within salaries, wages and benefits in operating expenses in the accompanying statements of
operations amounted to $ 0.5 million , $ 0.6 million and $ 0.1 million for 2011 , 2010 , and 2009 , respectively. During the years ended 2011 ,
2010 , and 2009 , there was no tax benefit recognized in income.
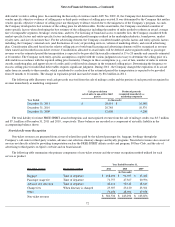
A summary of share option activity under the plan as of December 31, 2011 , and changes during 2011 are presented below:
The weighted-average fair value of option awards granted during the years ended December 31, 2011 and December 31, 2010 was $ 5.73
and $4.06 per share, respectively. There were no options granted during the year ended December 31, 2009. The total intrinsic value of share
options exercised during the year ended December 31, 2011 was $ 0.2 million . There were no options exercised during the years ended
December 31, 2010 or 2009.
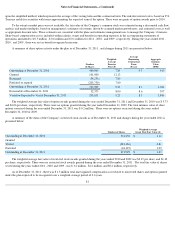
A summary of the status of the Company’s restricted stock awards as of December 31, 2011 and changes during the year ended 2011 is
presented below:
The weighted-average fair value of restricted stock awards granted during the years ended 2010 and 2009 was $6.39 per share, and $1.10
per share, respectively. There were no restricted stock awards granted during the year ended December 31, 2011 . The total fair value of shares
vested during the years ended 2011 , 2010 and 2009 , was $ 3.2 million , $2.2 million, and $0.2 million, respectively.
As of December 31, 2011 , there was $ 1.3 million total unrecognized compensation cost related to nonvested shares and options granted
under the plan expected to be recognized over a weighted-average period of 2.6 years.
81
Number
of Shares
Weighted-
Average
Exercise
Price ($)
Average
Remaining
Contractual
Term
(Years)
Aggregate
Intrinsic
Value
($000)
Outstanding at December 31, 2010
469,000
7.89
9.3
910
Granted
101,000
12.13
Exercised
(54,250
)
7.80
Forfeited or expired
(203,750
)
7.80
Outstanding at December 31, 2011
312,000
9.33
8.9
1,946
Exercisable at December 31, 2011
52,375
8.00
8.6
397
Vested or Expected to Vest at December 31, 2011
293,811
9.29
8.9
1,846
Number of Shares
Weighted-Average
Grant Date Fair Value ($)
Outstanding at December 31, 2010
573,250
$
1.12
Granted —
—
Vested
(283,126
)
0.81
Forfeited
(18,125
)
1.09
Outstanding at December 31, 2011
271,999
$
1.43