Spirit Airlines 2011 Annual Report Download - page 102
Download and view the complete annual report
Please find page 102 of the 2011 Spirit Airlines annual report below. You can navigate through the pages in the report by either clicking on the pages listed below, or by using the keyword search tool below to find specific information within the annual report.-
 1
1 -
2
-
3
-
4
-
5
-
6
-
7
-
8
-
9
-
10
-
11
-
12
-
13
-
14
-
15
-
16
-
17
-
18
-
19
-
20
-
21
-
22
-
23
-
24
-
25
-
26
-
27
-
28
-
29
-
30
-
31
-
32
-
33
-
34
-
35
-
36
-
37
-
38
-
39
-
40
-
41
-
42
-
43
-
44
-
45
-
46
-
47
-
48
-
49
-
50
-
51
-
52
-
53
-
54
-
55
-
56
-
57
-
58
-
59
-
60
-
61
-
62
-
63
-
64
-
65
-
66
-
67
-
68
-
69
-
70
-
71
-
72
-
73
-
74
-
75
-
76
-
77
-
78
-
79
-
80
-
81
-
82
-
83
-
84
-
85
-
86
-
87
-
88
-
89
-
90
-
91
-
 92
92 -
 93
93 -
 94
94 -
 95
95 -
 96
96 -
 97
97 -
 98
98 -
 99
99 -
 100
100 -
 101
101 -
 102
102 -
 103
103 -
 104
104 -
 105
105 -
 106
106 -
 107
107 -
 108
108 -
 109
109 -
 110
110 -
 111
111 -
 112
112 -
113
-
114
-
115
-
116
-
117
-
118
-
119
-
120
-
121
-
122
-
123
-
124
-
125
-
126
-
127
-
128
-
129
-
130
 |
 |

Notes to Financial Statements—(Continued)
Cash and cash equivalents at December 31, 2011 and 2010 are comprised of liquid money market funds and cash. The Company maintains
cash with various high-quality financial institutions.
The Company did not elect hedge accounting on any of the derivative instruments, and as a result, changes in the fair values of these fuel
hedge contracts are recorded each period in fuel expense. Fair values of the instruments are determined using standard option valuation models.
The Company also considers counterparty risk and its own credit risk in its determination of all estimated fair values. The Company has
consistently applied these valuation techniques in all periods presented and believes it has obtained the most accurate information available for
the types of derivative contracts its holds. Due to the fact that certain of the inputs utilized to determine the fair value of option contracts are
unobservable (principally implied volatility), the Company has categorized these option contracts as Level 3.
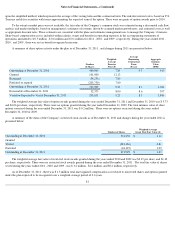
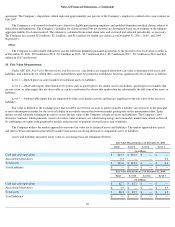
The following table presents the Company’s activity for assets measured at fair value on a recurring basis using significant unobservable
inputs (Level 3):
Total losses during 2011 included in earnings attributable to the change in unrealized gains or losses related to assets held during 2011 are
$3.2 million . Total gains during the year ended December 31, 2010 included in earnings attributable to the change in unrealized gains or losses
related to assets held through the twelve months ended December 31, 2010 is $2.1 million .
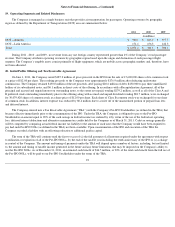
The carrying amounts and estimated fair values of the Company’s debt, related party notes payable and mandatorily redeemable preferred
stock at December 31, 2010, were as follows:
The Company’s debt is not publicly traded. Management determined the enterprise value of the Company using a discounted cash flow
analysis and market multiples. The fair values of certain debt instruments were estimated under a contingent claims analysis, in which a Black-
Scholes option pricing model was applied. As a corroborative measure, the implied internal rates of return resulting from the application of the
Black-Scholes model were compared to the current yields of certain term and other high-yield debt instruments of selected market participants
operating in the airline industry.
In connection with the closing of the IPO, the Company consummated the transaction contemplated by the Recapitalization Agreement on
June 1, 2011, which resulted in the repayment or exchange for common stock of all of the Company’s notes and preferred stock (see Note 20).
91
` Fuel Derivatives
(in millions)
Balance at January 1, 2009
$
—
Total gains (losses) (realized or unrealized) included in earnings, net
0.7
Settlements, net
0.7
Balance at December 31, 2009
1.4
Total gains (losses) (realized or unrealized) included in earnings, net
3.5
Settlements, net
(1.4
)
Balance at December 31, 2010
3.5
Total gains (losses) (realized or unrealized) included in earnings, net
4.2
Settlements, net
(7.4
)
Balance at December 31, 2011
$
0.3
Carrying Value
Estimated Fair Value
(in millions)
Fixed-rate debt
$
355.9
$
403.8
Variable-rate debt
4.6
5.0
Total debt
$
360.5
$
408.8