Spirit Airlines 2011 Annual Report Download - page 58
Download and view the complete annual report
Please find page 58 of the 2011 Spirit Airlines annual report below. You can navigate through the pages in the report by either clicking on the pages listed below, or by using the keyword search tool below to find specific information within the annual report.-
 1
1 -
2
-
3
-
4
-
5
-
6
-
7
-
8
-
9
-
10
-
11
-
12
-
13
-
14
-
15
-
16
-
17
-
18
-
19
-
20
-
21
-
22
-
23
-
24
-
25
-
26
-
27
-
28
-
29
-
30
-
31
-
32
-
33
-
34
-
35
-
36
-
37
-
38
-
39
-
40
-
41
-
42
-
43
-
44
-
45
-
46
-
47
-
 48
48 -
 49
49 -
 50
50 -
 51
51 -
 52
52 -
 53
53 -
 54
54 -
 55
55 -
 56
56 -
 57
57 -
 58
58 -
 59
59 -
 60
60 -
 61
61 -
 62
62 -
 63
63 -
 64
64 -
 65
65 -
 66
66 -
 67
67 -
 68
68 -
69
-
70
-
71
-
72
-
73
-
74
-
75
-
76
-
77
-
78
-
79
-
80
-
81
-
82
-
83
-
84
-
85
-
86
-
87
-
88
-
89
-
90
-
91
-
92
-
93
-
94
-
95
-
96
-
97
-
98
-
99
-
100
-
101
-
102
-
103
-
104
-
105
-
106
-
107
-
108
-
109
-
110
-
111
-
112
-
113
-
114
-
115
-
116
-
117
-
118
-
119
-
120
-
121
-
122
-
123
-
124
-
125
-
126
-
127
-
128
-
129
-
130
 |
 |

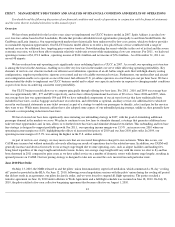
operating income of $68.9 million and net income of $72.5 million on operating revenues of $781.3 million during 2010 .
The increase in operating income in 2011 over 2010 of $75.5 million or 109.6% is mainly due to a 37.1% increase in revenue partially
offset by increased fuel prices and increases in various other operating costs. Revenue increased year over year as a result of a 4.3% increase in
load factor, a 15.2% increase in capacity and a 14.2% increase in average yield. Fuel costs increased by $139.8 million during 2011 compared to
2010 , primarily driven by a 35.3% increase in the price per gallon and a 13.5% increase in consumption. Operating expenses increased as we
increased our operating activities year over year including the addition of five additional aircraft to the fleet resulting in the increased capacity.
We improved our liquidity position with the completion of an IPO in June 2011, whereby we retained $150.0 million of net of proceeds,
after paying off debt, fees and costs associated with the offering.
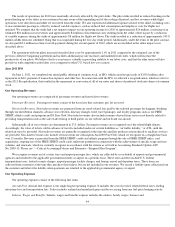
Net income for 2010 of $72.5 million includes a $52.3 million net tax benefit primarily due to the release of a valuation allowance
resulting in a deferred tax benefit of $52.8 million in 2010. Absent the release of the valuation allowance and corresponding tax benefit, our net
income would have been $19.7 million for 2010. In 2010, we recorded operating income of $68.9 million on $781.3 million of operating
revenues. The results of operations for 2010 were adversely affected by an increase in fuel prices and the effects of our June 2010 pilot strike.
Fuel cost increased by $67.1 million from 2009 to 2010, caused principally by a 27% increase in the price per gallon and an 8.3% increase in
fuel volume during 2010 compared to 2009.
The June 2010 pilot strike resulted in reduced bookings in the period leading up to the strike as our customers became aware of the
impending end of the cooling off period and lost revenues as flight operations were shut down and later cut back following the resumption of
flight operations. We also experienced additional expenses related to the strike, including costs to reaccommodate passengers, offset in part by
reduction in other expenses, such as aircraft fuel and salaries, wages and benefits. We estimate that the strike had a net negative impact on our
operating income for 2010 of approximately $24 million, consisting of an estimated $28 million in lost revenues and approximately $4 million of
incremental costs, offset in part by a reduction of variable expenses of approximately $8 million for flights not flown. The strike resulted in a
reduction of approximately 145.8 million ASMs from our scheduled flights that were suspended during the five-day strike period. Additionally,
under the terms of the pilot contract, we paid and expensed $2.3 million in return-to-work payments during the second quarter of 2010, which
are not included in the strike impact costs described above.
In 2009, we recorded net income of $83.7 million and operating income of $111.4 million on $700.0 million of operating revenues. Our
2009 earnings were driven by increased market maturity on our newer routes, relative stability in RASM, decreased Adjusted CASM ex fuel,
and lower fuel prices. During 2009, we also recognized debt extinguishment gains of $19.7 million related to contractual provisions of our
recapitalization in mid-2006.
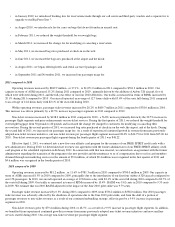
Operating Revenue
Non-ticket revenues have continued to grow and comprise 35.6% of our total revenue for fiscal 2011 due to the effect of unbundling our
fares and the introduction of new services beyond the sale of a ticket for transportation, including:
51
Year Ended 2011
% change 2011
versus 2010
Year Ended 2010
% change 2010
versus 2009
Year Ended 2009
Passenger
$
689,650
28.2 %
$
537,969
0.3 %
$
536,181
Non-ticket
381,536
56.8 %
243,296
48.5 %
163,856
Total operating revenue
$
1,071,186
37.1 %
$
781,265
11.6 %
$
700,037
RASM (cents)
11.45
19.1
%
9.62
2.9 %
9.35
Average ticket revenue per
passenger flight segment
$
80.97
4.6 %
$
77.39
(8.7
)%
$
84.77
Average non-ticket revenue
per passenger flight
segment
44.79
28.0 %
35.00
35.1 %
25.91
Total revenue per
passenger flight segment
$
125.76
11.9 %
$
112.39
1.5 %
$
110.68