Spirit Airlines 2011 Annual Report Download - page 47
Download and view the complete annual report
Please find page 47 of the 2011 Spirit Airlines annual report below. You can navigate through the pages in the report by either clicking on the pages listed below, or by using the keyword search tool below to find specific information within the annual report.-
 1
1 -
2
-
3
-
4
-
5
-
6
-
7
-
8
-
9
-
10
-
11
-
12
-
13
-
14
-
15
-
16
-
17
-
18
-
19
-
20
-
21
-
22
-
23
-
24
-
25
-
26
-
27
-
28
-
29
-
30
-
31
-
32
-
33
-
34
-
35
-
36
-
 37
37 -
 38
38 -
 39
39 -
 40
40 -
 41
41 -
 42
42 -
 43
43 -
 44
44 -
 45
45 -
 46
46 -
 47
47 -
 48
48 -
 49
49 -
 50
50 -
 51
51 -
 52
52 -
 53
53 -
 54
54 -
 55
55 -
 56
56 -
 57
57 -
58
-
59
-
60
-
61
-
62
-
63
-
64
-
65
-
66
-
67
-
68
-
69
-
70
-
71
-
72
-
73
-
74
-
75
-
76
-
77
-
78
-
79
-
80
-
81
-
82
-
83
-
84
-
85
-
86
-
87
-
88
-
89
-
90
-
91
-
92
-
93
-
94
-
95
-
96
-
97
-
98
-
99
-
100
-
101
-
102
-
103
-
104
-
105
-
106
-
107
-
108
-
109
-
110
-
111
-
112
-
113
-
114
-
115
-
116
-
117
-
118
-
119
-
120
-
121
-
122
-
123
-
124
-
125
-
126
-
127
-
128
-
129
-
130
 |
 |

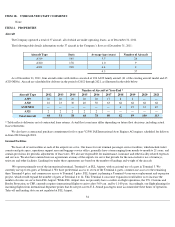
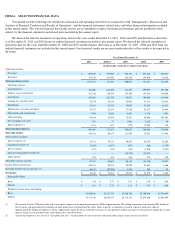
OPERATING STATISTICS
40
Year Ended December 31,
2011
2010
2009
2008
2007
Operating Statistics (unaudited) (A)
Average aircraft
34.8
30.5
28.0
32.8
35.9
Aircraft at end of period
37
32
28
28
36
Airports served in the period
48
39
43
45
40
Average daily Aircraft utilization (hours)
12.7
12.8
13.0
12.6
11.5
Average stage length (miles)
921
941
931
925
956
Block hours
161,898
141,864
133,227
150,827
150,644
Passenger flight segments (thousands)
8,518
6,952
6,325
6,976
6,974
Revenue passenger miles (RPMs) (thousands)
8,006,748
6,664,395
6,039,064
6,599,809
6,850,565
Available seat miles (ASMs) (thousands)
9,352,553
8,119,923
7,485,141
8,262,230
8,461,861
Load factor (%)
85.6
82.1
80.7
79.9
81.0
Average ticket revenue per passenger flight segment ($)
80.97
77.39
84.77
94.24
98.44
Average non-ticket revenue per passenger flight segment
($)
44.79
35.00
25.91
18.61
10.96
Total revenue per passenger segment ($)
125.76
112.39
110.68
112.85
109.40
Average yield (cents)
13.38
11.72
11.59
11.93
11.14
RASM (cents)
11.45
9.62
9.35
9.53
9.02
CASM (cents)
9.91
8.77
7.86
9.31
8.64
Adjusted CASM (cents) (B)
9.84
8.79
7.89
8.97
8.76
Adjusted CASM ex fuel (cents) (B)
5.72
5.71
5.45
5.47
5.67
Fuel gallons consumed (thousands)
121,030
106,628
98,422
109,562
113,842
Average economic fuel cost per gallon ($)
3.18
2.35
1.85
2.64
2.30
(A) See “Glossary of Airline Terms”
elsewhere in this annual report for definitions of terms used in this table.
(B) Excludes restructuring and termination costs of $0.1 million (less than 0.01 cents per ASM) in 2007 and $17.9 million (0.22 cents per ASM) in 2008; and credits of $0.4
million (less than 0.01 cents per ASM) in 2009, and $0.6 million (less than 0.01 cents per ASM) in 2010, and $3.2 million (0.03 cents per ASM) in 2011. These amounts
are excluded from all calculations of Adjusted CASM provided in this prospectus. Please see “Management’
s Discussion and Analysis of Financial Condition and Results
of Operations—Our Operating Expenses—Special charges” Also excludes unrealized mark-to-market, or MTM, (gains) and losses of $(10.3) million ((0.12) cents per
ASM) in 2007, $9.9 million (0.12 cents per ASM) in 2008, $(1.4) million ((0.02) cents per ASM) in 2009 and $(2.1) million ((0.03) cents per ASM) in 2010, and $3.2
million (0.03 cents per ASM) in 2011. Please see “Management’s Discussion and Analysis of Financial Condition and Results of Operations—Critical Accounting
Policies and Estimates.”