Spirit Airlines 2011 Annual Report Download - page 65
Download and view the complete annual report
Please find page 65 of the 2011 Spirit Airlines annual report below. You can navigate through the pages in the report by either clicking on the pages listed below, or by using the keyword search tool below to find specific information within the annual report.-
 1
1 -
2
-
3
-
4
-
5
-
6
-
7
-
8
-
9
-
10
-
11
-
12
-
13
-
14
-
15
-
16
-
17
-
18
-
19
-
20
-
21
-
22
-
23
-
24
-
25
-
26
-
27
-
28
-
29
-
30
-
31
-
32
-
33
-
34
-
35
-
36
-
37
-
38
-
39
-
40
-
41
-
42
-
43
-
44
-
45
-
46
-
47
-
48
-
49
-
50
-
51
-
52
-
53
-
54
-
 55
55 -
 56
56 -
 57
57 -
 58
58 -
 59
59 -
 60
60 -
 61
61 -
 62
62 -
 63
63 -
 64
64 -
 65
65 -
 66
66 -
 67
67 -
 68
68 -
 69
69 -
 70
70 -
 71
71 -
 72
72 -
 73
73 -
 74
74 -
 75
75 -
76
-
77
-
78
-
79
-
80
-
81
-
82
-
83
-
84
-
85
-
86
-
87
-
88
-
89
-
90
-
91
-
92
-
93
-
94
-
95
-
96
-
97
-
98
-
99
-
100
-
101
-
102
-
103
-
104
-
105
-
106
-
107
-
108
-
109
-
110
-
111
-
112
-
113
-
114
-
115
-
116
-
117
-
118
-
119
-
120
-
121
-
122
-
123
-
124
-
125
-
126
-
127
-
128
-
129
-
130
 |
 |

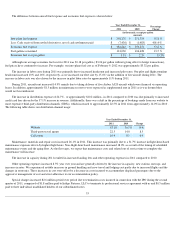
The increase in landing fees and other rents was driven by an increase in landing fees and airport facility rental rates in response to overall
reduced industry capacity, which caused many airports to attempt to mitigate lost operating revenues by raising rates and fees.
The increase in maintenance, materials and repair costs in 2010 was primarily due to an increase in the scope of required maintenance
events in 2010 compared to those occurring during 2009. As the fleet ages, we expect that maintenance costs and related out of service time to
complete the maintenance will increase in absolute terms.
The increase in other operating expenses in 2010 is primarily due to increases in ground handling costs, and aviation insurance resulting
from a period-over-period increase in the number of flights operated and fleet size, coupled with incremental costs incurred to accommodate
displaced passengers due to our June 2010 pilot strike and other flight disruptions. Furthermore, in 2009 we had a non-recurring benefit of $3.0
million related to a refund from the TSA related to over-collections of security charges in prior years.
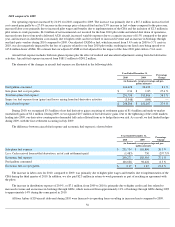
Other (income) expense, net
2011 compared to 2010
Other expense, net decreased by $ 27.1 million to $21.6 million for 2011 from $48.7 million for 2010 . The decrease is primarily related to
interest on debt for only five months in 2011 compared to a full year in 2010 as a result of the elimination of our debt in conjunction with the
IPO in June of 2011. Related-party interest expense incurred during 2011 and 2010 was $21.0 million and $44.6 million, respectively, and
consisted primarily of paid-in-kind interest on notes and preferred stock dividends due to related parties. Non-related party interest expense
during 2011 and 2010 was $3.8 million and $5.7 million, respectively.
2010 compared to 2009
We recorded other expense, net of $48.7 million for 2010 compared to other expense, net of $26.2 million for 2009. Related-party interest
expense incurred during 2010 and 2009 was $44.6 million and $39.3 million, respectively, and consisted primarily of paid-in-kind interest on
notes and preferred stock dividends due to related parties. Non-related party interest expense during 2010 and 2009 was $5.7 million and $7.6
million, respectively.
Income Taxes
Our federal net operating loss carryforward, or NOL, was $142.8 million as of December 31, 2009. As of December 31, 2011 and 2010,
we had NOLs for federal income tax purposes of $16.3 million and $112.1 million, respectively, which would begin to expire in 2023. These
amounts exclude $10.0 million of NOLs, the use of which is limited under Section 382 of the U.S. Internal Revenue Code, and as a result, we
determined that this amount would not be able to be utilized. In addition, as of December 31, 2011 and 2010, we had state NOLs of
approximately $9.1 million and $41.9 million, respectively, which can be used to offset future state taxable income. The effective tax rate for
2011 was approximately 37.8%.
At December 31, 2009, we had recorded a full valuation allowance against existing net deferred tax assets. As of September 30, 2010, we
determined that, under generally accepted accounting principles, the valuation allowance should be reduced by $53.5 million, which we
recognized as a deferred tax benefit.
Immediately prior to the IPO, we entered into the Tax Receivable Agreement and thereby distributed to the Pre-IPO Stockholders the right
to receive a pro rata share of the future payments to be made under such agreement. These future payments to the Pre-IPO Stockholders will be
in an amount equal to 90% of the cash savings in federal income tax realized by us by virtue of our future use of federal NOL, deferred interest
deductions and certain tax credits held by us as of March 31, 2011. Please see “Certain Relationships and Related Transactions—
Tax Receivable
Agreement.”
57