Spirit Airlines 2011 Annual Report Download - page 62
Download and view the complete annual report
Please find page 62 of the 2011 Spirit Airlines annual report below. You can navigate through the pages in the report by either clicking on the pages listed below, or by using the keyword search tool below to find specific information within the annual report.-
 1
1 -
2
-
3
-
4
-
5
-
6
-
7
-
8
-
9
-
10
-
11
-
12
-
13
-
14
-
15
-
16
-
17
-
18
-
19
-
20
-
21
-
22
-
23
-
24
-
25
-
26
-
27
-
28
-
29
-
30
-
31
-
32
-
33
-
34
-
35
-
36
-
37
-
38
-
39
-
40
-
41
-
42
-
43
-
44
-
45
-
46
-
47
-
48
-
49
-
50
-
51
-
 52
52 -
 53
53 -
 54
54 -
 55
55 -
 56
56 -
 57
57 -
 58
58 -
 59
59 -
 60
60 -
 61
61 -
 62
62 -
 63
63 -
 64
64 -
 65
65 -
 66
66 -
 67
67 -
 68
68 -
 69
69 -
 70
70 -
 71
71 -
 72
72 -
73
-
74
-
75
-
76
-
77
-
78
-
79
-
80
-
81
-
82
-
83
-
84
-
85
-
86
-
87
-
88
-
89
-
90
-
91
-
92
-
93
-
94
-
95
-
96
-
97
-
98
-
99
-
100
-
101
-
102
-
103
-
104
-
105
-
106
-
107
-
108
-
109
-
110
-
111
-
112
-
113
-
114
-
115
-
116
-
117
-
118
-
119
-
120
-
121
-
122
-
123
-
124
-
125
-
126
-
127
-
128
-
129
-
130
 |
 |

2011 compared to 2010
Our operating expenses increased by approximately 30.1% for 2011 compared to the corresponding period in 2010 . The increase is
primarily related to a 56.3% increase in fuel costs, 16.2% increase in labor cost, and a 14.9%
increase in aircraft rent. Fuel costs were driven by a
35.3% increase in the average price of aircraft fuel per gallon and a 13.5% increase in gallons consumed.
Aircraft fuel expenses includes both into-plane expense (as defined below) plus the effect of mark-to-market adjustments to our portfolio
of derivative instruments, which is a component of aircraft fuel expenses. Into-plane fuel expense is defined as the price that we generally pay at
the airport, or the “into-plane” price, including taxes and fees. Into-plane fuel prices are affected by world oil prices and refining costs, which
can vary by region in the United States and the other countries where we operate. Fuel prices increased significantly during 2011. Into-
plane fuel
expense approximates cash paid to the supplier and does not reflect the effect of our fuel derivatives. Because our fuel derivative contracts do not
qualify for hedge accounting, we recognize changes in the fair value of our derivatives when they occur, as a component of aircraft fuel expense,
both realized and unrealized. Aircraft fuel expense increased from $248.2 million in 2010 to $388.0 million in 2011 , representing 41.9% of our
total operating expenses for that 2011 period.
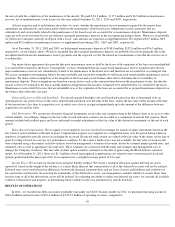
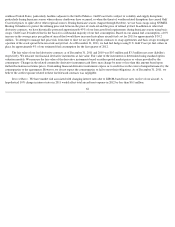
The elements of the changes in aircraft fuel expense are illustrated in the following table:
During 2011 , we recognized $4.2 million of net fuel derivative gains consisting of settlement gains of $7.4 million and mark-to-market
losses (unrealized) of $3.2 million . During 2010 , we recognized $3.5 million of net fuel derivative gains consisting of realized gains of $1.4
million and mark-to-market gains (unrealized) of $2.1 million .
We evaluate economic fuel expense , which we define as into-plane fuel expense less the cash we received from hedge counterparties for
hedges that we settle during the relevant period, including hedges that we terminate early during the period. The key difference between aircraft
fuel expense
and economic fuel expense is the timing of gain or loss recognition on our hedge portfolio. When we refer to economic fuel
expense, we include net settlement gains or losses only when they are realized through a cash payment from our derivative contract
counterparties for those contracts that were settled during the period. We believe this is the best measure of the effect that fuel prices are
currently having on our business because it most closely approximates the net cash outflow associated with purchasing fuel for our operations.
Accordingly, many industry analysts evaluate airline results using this measure and it is used in our internal management reporting.
54
(2) Includes special charges of $3.2 million (0.03 cents per ASM) in 2011 , $0.6 million (less than 0.01 cents per ASM) in 2010 and credits
of $0.4 million (less than 0.01 cents per ASM) in 2009. Special charges for 2011 include $2.3 million of termination costs in connection
with the IPO comprised of amounts paid to Indigo Partners, LLC to terminate its professional services agreement with us and fees paid
to three individual, unaffiliated holders of our subordinated notes and in the fourth quarter include legal, accounting, printing, and filing
fees connected with the secondary offering which was consummated on January 25, 2012 . Special charges for 2010 and 2009 include
exit facility costs associated with amounts relating to the sale of previously-expensed MD-80 parts and exit facility costs associated
with moving our Detroit, Michigan maintenance activities to Fort Lauderdale, Florida, and for 2011 included termination costs in
connection with the IPO during the three months ended June 30, 2011 comprised of amounts paid to Indigo Partners, LLC to terminate
its professional services agreement with us and fees paid to three individual, unaffiliated holders of our subordinated notes. Special
charges for 2009 include amounts relating to the early termination in mid-2008 of leases for seven Airbus A319 aircraft, a related
reduction in workforce and exit facility costs associated with returning planes in 2008. Please see “—Our Operating Expenses—
Special
Charges.”
Year Ended December 31,
Percentage Change
2011
2010
(in thousands, except per-gallon amounts)
Fuel gallons consumed
121,030
106,628
13.5 %
Into-plane fuel cost per gallon
$3.24
$2.36
37.3 %
Total into-plane fuel expense
$
392,278
$
251,754
55.8 %
Impact on fuel expense from (gains) and losses arising from fuel-derivative activities
(4,232
)
(3,548
)
19.3 %
Aircraft fuel expense
$
388,046
$
248,206
56.3 %