Spirit Airlines 2011 Annual Report Download - page 66
Download and view the complete annual report
Please find page 66 of the 2011 Spirit Airlines annual report below. You can navigate through the pages in the report by either clicking on the pages listed below, or by using the keyword search tool below to find specific information within the annual report.-
 1
1 -
2
-
3
-
4
-
5
-
6
-
7
-
8
-
9
-
10
-
11
-
12
-
13
-
14
-
15
-
16
-
17
-
18
-
19
-
20
-
21
-
22
-
23
-
24
-
25
-
26
-
27
-
28
-
29
-
30
-
31
-
32
-
33
-
34
-
35
-
36
-
37
-
38
-
39
-
40
-
41
-
42
-
43
-
44
-
45
-
46
-
47
-
48
-
49
-
50
-
51
-
52
-
53
-
54
-
55
-
 56
56 -
 57
57 -
 58
58 -
 59
59 -
 60
60 -
 61
61 -
 62
62 -
 63
63 -
 64
64 -
 65
65 -
 66
66 -
 67
67 -
 68
68 -
 69
69 -
 70
70 -
 71
71 -
 72
72 -
 73
73 -
 74
74 -
 75
75 -
 76
76 -
77
-
78
-
79
-
80
-
81
-
82
-
83
-
84
-
85
-
86
-
87
-
88
-
89
-
90
-
91
-
92
-
93
-
94
-
95
-
96
-
97
-
98
-
99
-
100
-
101
-
102
-
103
-
104
-
105
-
106
-
107
-
108
-
109
-
110
-
111
-
112
-
113
-
114
-
115
-
116
-
117
-
118
-
119
-
120
-
121
-
122
-
123
-
124
-
125
-
126
-
127
-
128
-
129
-
130
 |
 |

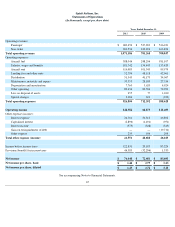
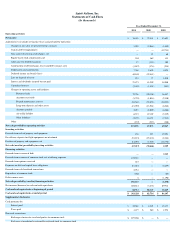
Quarterly Financial Data (unaudited)
58
Three Months Ended
March 31,
2010
June 30,
2010
September 30,
2010
December 31,
2010
March 31,
2011
June 30,
2011
September 30,
2011
December 31,
2011
(in thousands except share and per share amounts)
Total operating revenue
$
184,051
$
177,359
$
203,655
$
216,200
$
232,662
$
275,891
$
288,714
$
273,919
Passenger
136,909
126,372
138,232
136,456
153,280
180,418
186,682
169,270
Non-ticket
47,142
50,987
65,423
79,744
79,382
95,473
102,032
104,649
Operating income
24,124
1,791
20,982
21,976
26,844
34,959
44,556
38,023
Net income (loss)
$
11,276
$
(10,066
)
$
61,740
$
9,531
$
7,883
$
16,917
27,657
23,991
Earnings Per Share:
Basic
$
0.43
$
(0.38
)
$
2.35
$
0.36
$
0.30
$
0.41
$
0.38
$
0.33
Diluted
$
0.42
$
(0.38
)
$
2.33
$
0.36
$
0.30
$
0.41
$
0.38
$
0.33
Weighted average shares outstanding
Basic
26,056,908
26,164,318
26,240,764
26,270,129
26,347,875
41,493,312
72,175,478
72,242,360
Diluted
26,760,781
26,164,318
26,524,727
26,677,645
26,689,151
41,769,049
72,427,286
72,472,524
Three Months Ended
March 31,
2010
June 30,
2010
September 30,
2010
December 31,
2010
March 31,
2011
June 30,
2011
September 30,
2011
December 31,
2011
Other operating statistics
Aircraft at end of period
29
31
32
32
35
35
35
37
Airports served
39
39
39
39
44
45
47
48
Average daily Aircraft utilization (hours)
12.9
12.1
13.1
12.9
12.6
13.1
12.9
12.3
Average stage length (miles)
942
928
940
952
961
932
909
885
Passenger flight segments (thousands)
1,526
1,611
1,910
1,905
1,863
2,200
2,285
2,170
Revenue passenger miles (RPMs) (thousands)
1,464,645
1,519,609
1,824,795
1,855,346
1,847,280
2,083,804
2,109,119
1,966,545
Available seat miles (ASMs) (thousands)
1,820,131
1,905,053
2,194,099
2,200,640
2,200,097
2,425,642
2,422,962
2,303,852
Load factor (%)
80.5
79.8
83.2
84.3
84.0
85.9
87.0
85.4
Average ticket revenue per passenger flight
segment ($)
89.74
78.43
72.38
71.62
82.30
82.00
81.71
78.00
Average non-ticket revenue per passenger flight
segment ($)
30.90
31.64
34.26
41.86
42.62
43.39
44.66
48.22
Operating revenue per ASM (RASM) (cents)
10.11
9.31
9.28
9.82
10.58
11.37
11.92
11.89
CASM (cents)
8.79
9.22
8.33
8.83
9.35
9.93
10.08
10.24
CASM excluding restructuring, or Adjusted
CASM (cents) (1)(2)
8.82
9.10
8.43
8.86
9.38
9.70
10.01
10.25
Adjusted CASM ex fuel (cents) (1)
5.83
6.03
5.42
5.62
5.67
5.41
5.74
6.08
Fuel gallons consumed (thousands)
24,200
24,965
28,791
28,672
28,172
31,264
31,640
29,954
Average economic fuel cost per gallon ($)
2.25
2.34
2.30
2.48
2.89
3.32
3.27
3.21