Spirit Airlines 2011 Annual Report Download - page 44
Download and view the complete annual report
Please find page 44 of the 2011 Spirit Airlines annual report below. You can navigate through the pages in the report by either clicking on the pages listed below, or by using the keyword search tool below to find specific information within the annual report.-
 1
1 -
2
-
3
-
4
-
5
-
6
-
7
-
8
-
9
-
10
-
11
-
12
-
13
-
14
-
15
-
16
-
17
-
18
-
19
-
20
-
21
-
22
-
23
-
24
-
25
-
26
-
27
-
28
-
29
-
30
-
31
-
32
-
33
-
 34
34 -
 35
35 -
 36
36 -
 37
37 -
 38
38 -
 39
39 -
 40
40 -
 41
41 -
 42
42 -
 43
43 -
 44
44 -
 45
45 -
 46
46 -
 47
47 -
 48
48 -
 49
49 -
 50
50 -
 51
51 -
 52
52 -
 53
53 -
 54
54 -
55
-
56
-
57
-
58
-
59
-
60
-
61
-
62
-
63
-
64
-
65
-
66
-
67
-
68
-
69
-
70
-
71
-
72
-
73
-
74
-
75
-
76
-
77
-
78
-
79
-
80
-
81
-
82
-
83
-
84
-
85
-
86
-
87
-
88
-
89
-
90
-
91
-
92
-
93
-
94
-
95
-
96
-
97
-
98
-
99
-
100
-
101
-
102
-
103
-
104
-
105
-
106
-
107
-
108
-
109
-
110
-
111
-
112
-
113
-
114
-
115
-
116
-
117
-
118
-
119
-
120
-
121
-
122
-
123
-
124
-
125
-
126
-
127
-
128
-
129
-
130
 |
 |

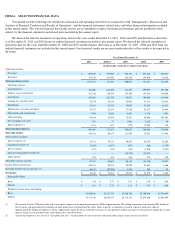
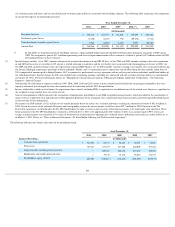
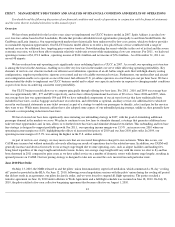
ITEM 6. SELECTED FINANCIAL DATA
You should read the following selected historical financial and operating data below in conjunction with “Management’s Discussion and
Analysis of Financial Condition and Results of Operations” and the financial statements, related notes and other financial information included
in this annual report. The selected financial data in this section are not intended to replace the financial statements and are qualified in their
entirety by the financial statements and related notes included in this annual report.
We derived the selected statements of operations data for the years ended December 31, 2011 , 2010 and 2009 and the balance sheet data
as of December 31, 2011 and 2010 from our audited financial statements included in this annual report. We derived the selected statements of
operations data for the years ended December 31, 2008 and 2007 and the balance sheet data as of December 31, 2007 , 2008 and 2009 from our
audited financial statements not included in this annual report. Our historical results are not necessarily indicative of the results to be expected in
the future.
Year Ended December 31,
2011
2010 (1)
2009
2008
2007
(in thousands except share and per share data)
Operating revenues:
Passenger
$
689,650
$
537,969
$
536,181
$
657,448
$
686,447
Non-ticket
381,536
243,296
163,856
129,809
76,432
Total operating revenue
1,071,186
781,265
700,037
787,257
762,879
Operating expenses:
Aircraft fuel (2)
388,046
248,206
181,107
299,094
251,230
Salaries, wages and benefits
181,742
156,443
135,420
147,015
146,626
Aircraft rent
116,485
101,345
89,974
105,605
119,686
Landing fees and other rents
52,794
48,118
42,061
43,331
42,441
Distribution
51,349
41,179
34,067
37,816
36,315
Maintenance, materials and repairs
35,553
28,189
27,536
24,237
23,448
Depreciation and amortization
7,760
5,620
4,924
4,236
5,401
Other operating
89,636
82,594
72,921
85,608
105,503
Loss on disposal of assets
255
77
1,010
4,122
94
Special charges (3)
3,184
621
(392
)
17,902
142
Total operating expenses
926,804
712,392
588,628
768,966
730,886
Operating income
144,382
68,873
111,409
18,291
31,993
Other expense (income):
Interest expense (4)
24,781
50,313
46,892
40,245
38,163
Capitalized interest (5)
(2,890
)
(1,491
)
(951
)
(166
)
(1,755
)
Interest income
(575
)
(328
)
(345
)
(1,976
)
(5,951
)
Gain on extinguishment of debt (6) —
—
(
19,711
)
(53,673
)
—
Other expense
235
194
298
214
130
Total other expense (income)
21,551
48,688
26,183
(15,356
)
30,587
Income before income taxes
122,831
20,185
85,226
33,647
1,406
Provision (benefit) for income taxes (7)
46,383
(52,296
)
1,533
388
44
Net income
$
76,448
$
72,481
$
83,693
$
33,259
$
1,362
Earnings Per Share:
Basic
$
1.44
$
2.77
$
3.23
$
1.29
$
0.05
Diluted
$
1.43
$
2.72
$
3.18
$
1.29
$
0.05
Weighted average shares outstanding:
Basic
53,240,898
26,183,772
25,910,766
25,780,070
25,746,445
Diluted
53,515,348
26,689,855
26,315,121
25,879,860
25,861,095
(1) We estimate that the 2010 pilot strike had a net negative impact on our operating income for 2010 of approximately $24 million consisting of an estimated $28 million in
lost revenues and approximately $4 million of incremental costs resulting from the strike, offset in part by a reduction of variable expenses during the strike of
approximately $8 million for flights not flown. Additionally, under the terms of the pilot contract, we also paid $2.3 million in return-to-
work payments during the second
quarter, which are not included in the strike impact costs described above.
(2) Aircraft fuel expense is the sum of (i) “into-plane fuel cost,”
which includes the cost of jet fuel and certain other charges such as fuel taxes and oil,