Spirit Airlines 2011 Annual Report Download - page 67
Download and view the complete annual report
Please find page 67 of the 2011 Spirit Airlines annual report below. You can navigate through the pages in the report by either clicking on the pages listed below, or by using the keyword search tool below to find specific information within the annual report.-
 1
1 -
2
-
3
-
4
-
5
-
6
-
7
-
8
-
9
-
10
-
11
-
12
-
13
-
14
-
15
-
16
-
17
-
18
-
19
-
20
-
21
-
22
-
23
-
24
-
25
-
26
-
27
-
28
-
29
-
30
-
31
-
32
-
33
-
34
-
35
-
36
-
37
-
38
-
39
-
40
-
41
-
42
-
43
-
44
-
45
-
46
-
47
-
48
-
49
-
50
-
51
-
52
-
53
-
54
-
55
-
56
-
 57
57 -
 58
58 -
 59
59 -
 60
60 -
 61
61 -
 62
62 -
 63
63 -
 64
64 -
 65
65 -
 66
66 -
 67
67 -
 68
68 -
 69
69 -
 70
70 -
 71
71 -
 72
72 -
 73
73 -
 74
74 -
 75
75 -
 76
76 -
 77
77 -
78
-
79
-
80
-
81
-
82
-
83
-
84
-
85
-
86
-
87
-
88
-
89
-
90
-
91
-
92
-
93
-
94
-
95
-
96
-
97
-
98
-
99
-
100
-
101
-
102
-
103
-
104
-
105
-
106
-
107
-
108
-
109
-
110
-
111
-
112
-
113
-
114
-
115
-
116
-
117
-
118
-
119
-
120
-
121
-
122
-
123
-
124
-
125
-
126
-
127
-
128
-
129
-
130
 |
 |

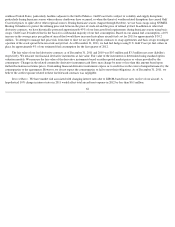
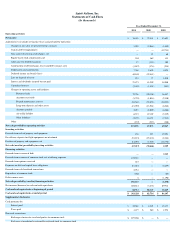
(1) Excludes special credits of $0.02 million (less than 0.01 cents per ASM) in the three months ended March 31, 2010, less than $0.1 million (less than 0.01 cents per ASM) in the
three months ended June 30, 2010, restructuring charges of $0.2 million (less than 0.01 cents per ASM) in the three months ended September 30, 2010, $0.5 million (0.02 cents per
ASM) in the three months ended December 31, 2010, $0.08 million (less than 0.01 cents per ASM) in the three months ended March 31, 2011, $2.3 million (0.09 cents per ASM) in
the three months ended June 30, 2011, $0.02 million (less than 0.01 cents per ASM) in the three months ended September 30, 2011 and $0.8 million (0.03 cents per ASM) in the
three months ended December 31, 2011. These amounts are excluded from all calculations of Adjusted CASM provided in this annual report. Please see “Management’
s Discussion
and Analysis of Financial Condition and Results of Operations—Our Operating Expenses—Special Charges.”
(2) Excludes unrealized mark-to-market (gains) and losses of ($0.6) million ((0.03) cents per ASM) in the three months ended March 31, 2010, $2.3 million (0.12 cents per ASM) in
the three months ended June 30, 2010, ($2.6) million ((0.12) cents per ASM) in the three months ended September 30, 2010, ($1.1) million ((0.05) cents per ASM) in the three
months ended December 31, 2010, $(0.6) million ((0.02) cents per ASM) in the three months ended March 31, 2011, $3.5 million (0.14 cents per ASM) in the three months ended
June 30, 2011, $1.5 million (0.06 cents per ASM) in the three months ended September 30, 2011 and $1.2 million (0.05 cents per ASM) in the three months ended December 31,
2011. Please see “Management’s Discussion and Analysis of Financial Condition and Results of Operations—Our Operating Expenses—Critical Accounting Policies and
Estimates.”
59