Spirit Airlines 2011 Annual Report Download - page 59
Download and view the complete annual report
Please find page 59 of the 2011 Spirit Airlines annual report below. You can navigate through the pages in the report by either clicking on the pages listed below, or by using the keyword search tool below to find specific information within the annual report.-
 1
1 -
2
-
3
-
4
-
5
-
6
-
7
-
8
-
9
-
10
-
11
-
12
-
13
-
14
-
15
-
16
-
17
-
18
-
19
-
20
-
21
-
22
-
23
-
24
-
25
-
26
-
27
-
28
-
29
-
30
-
31
-
32
-
33
-
34
-
35
-
36
-
37
-
38
-
39
-
40
-
41
-
42
-
43
-
44
-
45
-
46
-
47
-
48
-
 49
49 -
 50
50 -
 51
51 -
 52
52 -
 53
53 -
 54
54 -
 55
55 -
 56
56 -
 57
57 -
 58
58 -
 59
59 -
 60
60 -
 61
61 -
 62
62 -
 63
63 -
 64
64 -
 65
65 -
 66
66 -
 67
67 -
 68
68 -
 69
69 -
70
-
71
-
72
-
73
-
74
-
75
-
76
-
77
-
78
-
79
-
80
-
81
-
82
-
83
-
84
-
85
-
86
-
87
-
88
-
89
-
90
-
91
-
92
-
93
-
94
-
95
-
96
-
97
-
98
-
99
-
100
-
101
-
102
-
103
-
104
-
105
-
106
-
107
-
108
-
109
-
110
-
111
-
112
-
113
-
114
-
115
-
116
-
117
-
118
-
119
-
120
-
121
-
122
-
123
-
124
-
125
-
126
-
127
-
128
-
129
-
130
 |
 |

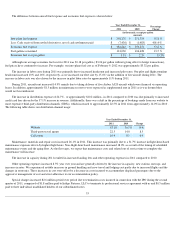
2011 compared to 2010
Operating revenues increased by $289.9 million , or 37.1% , to $1,071.2 million in 2011 compared to $781.3 million in 2010 . Our
capacity in terms of ASMs increased 15.2% during 2011 compared to 2010 , primarily driven by the addition of Airbus 320 aircraft, five of
which were delivered during 2011, and the full-year effect of our four 2010 deliveries. Our traffic as measured in terms of RPMs increased by
20.1% during 2011 compared to 2010 . Our aircraft operated an average of 12.7 hours daily with 85.6% of the seats full during 2011 compared
to an average of 12.8 hours daily with 82.1% of the seats full during 2010 .
Within operating revenues, passenger ticket revenue increased by 28.2% to $689.7 million in 2011 compared to $538.0 million in 2010 .
This increase was driven primarily by a 22.5% increase in passenger segments in 2011 compared to 2010 .
Non-ticket revenues increased by $138.2 million in 2011 compared to 2010 , a 56.8% increase primarily driven by the 22.5% increase in
passenger flight segments and price enhancements on non-ticket services. During the first quarter of 2011, we reduced the weight threshold for
overweight baggage from 50 pounds to 40 pounds and increased the change fee charged to customers for modifying or canceling their
reservations. During the second quarter of 2011, we increased bag rates purchased at check-in on the web, the airport, and at the kiosk. During
the second half of 2011, we increased our passenger usage fee. As a result of experienced continued growth in revenue from many previously
adopted non-ticket revenue initiatives, our non-ticket revenue per passenger flight segment increased 28.0% to $44.79 for 2011 from $35.00 for
2010 . Non-ticket revenue per passenger flight segment during the fourth quarter of 2011 was $48.22 .
Effective April 1, 2011, we entered into a new five-year affinity card program for the issuance of our FREE SPIRIT credit cards with a
new administrator. During 2010, we determined not to renew our agreement with the former administrator of our FREE SPIRIT affinity credit
card program at the scheduled expiration in February 2011. In connection with that non-renewal, we entered into an agreement with the former
administrator regarding the transition of the program to the new provider and the remittance to us of compensation due to us for card members
obtained through our marketing services in the amount of $5.0 million, of which $0.4 million was recognized in the first quarter of 2011 and
$4.6 million was recognized in the fourth quarter of 2010.
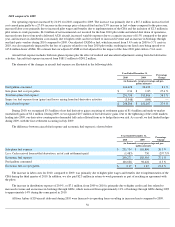
2010 compared to 2009
Operating revenues increased by $81.2 million , or 11.6% to $781.3 million in 2010 compared to $700.0 million in 2009. Our capacity in
terms of ASMs increased 8.5% in 2010 compared to 2009, principally due to the introduction of our first four Airbus A320 aircraft configured to
seat 178 passengers. In 2010, our aircraft operated an average of 12.8
hours a day with 82.1% of the seats full during 2010 compared to 80.7% of
the seats full during 2009. Our traffic as measured in terms of RPMs increased by 10.4%. RASM was 9.62 cents in 2010 compared to 9.35 cents
in 2009. We estimate that our 2010 RASM adjusted for the impact of the June 2010 pilot strike was 9.79 cents.
Passenger ticket revenue increased by 0.3% during 2010 compared to 2009, from $536.2 million to $538.0 million. Our 2010 passenger
ticket revenue was adversely affected by the shutdown of operations due to the June 2010 pilot strike, and from the shift of a portion of
passenger revenues to non-ticket revenues as a result of our continued unbundling strategy, offset in part by a 9.9% increase in passenger
segments in 2010.
Non-ticket revenues grew by $79.4 million during 2010, or 48.5%, as a result of a 9.9% increase in passenger flight segments. In addition,
we benefited from experienced continued growth in revenue from many previously adopted non-ticket revenue initiatives and new ancillary
services started during 2010. Our average non-ticket revenue per passenger flight segment
• in January 2010, we introduced booking fees for reservations made through our call center and third-party vendors and a separate fee to
upgrade to our Big Front Seat
®
;
• in August 2010, we introduced a fee for carry-
on bags that do not fit under an aircraft seat;
•
in February 2011, we reduced the weight threshold for overweight bags;
•
in March 2011, we increased the change fee for modifying or canceling a reservation;
• in May 2011, we increased bag rates purchased at check-
in on the web;
•
in June 2011, we increased the bag rates purchased at the airport and the kiosk;
•
in August 2011, we began offering hotels and rental car travel packages; and
•
in September 2011 and November 2011, we increased our passenger usage fee.