Spirit Airlines 2011 Annual Report Download - page 64
Download and view the complete annual report
Please find page 64 of the 2011 Spirit Airlines annual report below. You can navigate through the pages in the report by either clicking on the pages listed below, or by using the keyword search tool below to find specific information within the annual report.-
 1
1 -
2
-
3
-
4
-
5
-
6
-
7
-
8
-
9
-
10
-
11
-
12
-
13
-
14
-
15
-
16
-
17
-
18
-
19
-
20
-
21
-
22
-
23
-
24
-
25
-
26
-
27
-
28
-
29
-
30
-
31
-
32
-
33
-
34
-
35
-
36
-
37
-
38
-
39
-
40
-
41
-
42
-
43
-
44
-
45
-
46
-
47
-
48
-
49
-
50
-
51
-
52
-
53
-
 54
54 -
 55
55 -
 56
56 -
 57
57 -
 58
58 -
 59
59 -
 60
60 -
 61
61 -
 62
62 -
 63
63 -
 64
64 -
 65
65 -
 66
66 -
 67
67 -
 68
68 -
 69
69 -
 70
70 -
 71
71 -
 72
72 -
 73
73 -
 74
74 -
75
-
76
-
77
-
78
-
79
-
80
-
81
-
82
-
83
-
84
-
85
-
86
-
87
-
88
-
89
-
90
-
91
-
92
-
93
-
94
-
95
-
96
-
97
-
98
-
99
-
100
-
101
-
102
-
103
-
104
-
105
-
106
-
107
-
108
-
109
-
110
-
111
-
112
-
113
-
114
-
115
-
116
-
117
-
118
-
119
-
120
-
121
-
122
-
123
-
124
-
125
-
126
-
127
-
128
-
129
-
130
 |
 |

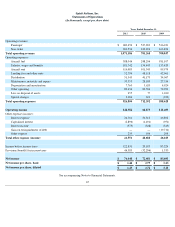
2010 compared to 2009
Our operating expenses increased by 21.0% for 2010 compared to 2009. The increase was primarily due to a $67.1 million increase in fuel
cost caused principally by a 27.0% increase in the average price of aircraft fuel and an 8.3% increase in fuel volume compared to the prior year,
increased labor costs primarily due to increased pilot wages and benefits due to implementation of the CBA and the inclusion of $2.3 million in
pilot return-to-work payments, $4.0 million of net incremental cost incurred for the June 2010 pilot strike and related shut down of operations,
increased rents due to four newly delivered A320 aircraft, increased variable expenses due to a capacity increase of 8.5% compared to the prior
year, and increases in distribution costs mainly due to higher credit card fees related to increased revenue and an increase in bookings through
our third-party vendors during 2010 compared to 2009. Our adjusted CASM ex fuel, which increased from 5.45 cents in 2009 to 5.71 cents in
2010, was also negatively impacted by the loss of capacity related to our June 2010 pilot strike, resulting in our fixed costs being spread over
145.8 million fewer ASMs. We estimate that our adjusted CASM ex fuel adjusted for the impact of the June 2010 pilot strike is 5.61 cents.
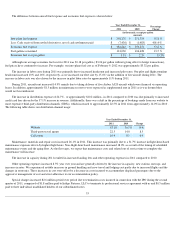
Aircraft fuel expense includes both into-plane expense plus the effect of realized and unrealized adjustments arising from fuel derivative
activities. Aircraft fuel expense increased from $181.1 million to $248.2 million.
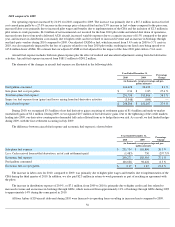
The elements of the changes in aircraft fuel expense are illustrated in the following table:
During 2010, we recognized $3.5 million of net fuel derivative gains consisting of settlement gains of $1.4 million and mark-to-market
(unrealized) gains of $2.1 million. During 2009, we recognized $0.7 million of fuel derivative gains. Due to the tightening of the credit markets
leading into 2009, our derivative counterparties demanded full cash collateral from us to hedge their own risk. As a result, we had limited hedges
during 2009, with the first settlement occurring in July 2009.
The difference between aircraft fuel expense and economic fuel expense is shown below:
The increase in labor costs for 2010, compared to 2009, was primarily due to higher pilot wages and benefits due to implementation of the
CBA during the third quarter of 2010. In addition, we also paid $2.3 million in return-to-work payments as part of reaching an agreement with
the pilots.
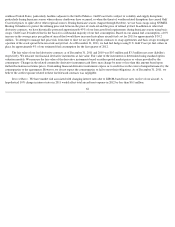
The increase in distribution expense of 20.9%, or $7.1 million, from 2009 to 2010 is primarily due to higher credit card fees related to
increased revenue and an increase in bookings through GDSs, which increased from approximately 11% of bookings through GDSs during 2009
to approximately 14% during the same period in 2010.
All four Airbus A320 aircraft delivered during 2010 were financed via operating leases resulting in increased rents compared to 2009.
56
Year Ended December 31,
Percentage
Change
2010
2009
(in thousands, except percentage and per-
gallon amounts)
Fuel gallons consumed
106,628
98,422
8.3 %
Into-plane fuel cost per gallon
$
2.36
$
1.85
27.6 %
Total into-plane fuel expense
251,754
181,806
38.5 %
Impact on fuel expense from (gains) and losses arising from fuel-derivative activities
(3,548
)
(699
)
—
Aircraft fuel expense
$
248,206
$
181,107
37.0 %
Year Ended December 31,
Percentage
Change
2010
2009
(in thousands, except percentage and per-
gallon amounts)
Into-plane fuel expense
$
251,754
$
181,806
38.5 %
Less: Cash received from settled derivatives, net of cash settlements paid
(1,483
)
750
(297.7
)%
Economic fuel expense
250,271
182,556
37.1 %
Fuel gallons consumed
106,628
98,422
8.3 %
Economic fuel cost per gallon
$
2.35
$
1.85
27.0 %