Spirit Airlines 2011 Annual Report Download - page 68
Download and view the complete annual report
Please find page 68 of the 2011 Spirit Airlines annual report below. You can navigate through the pages in the report by either clicking on the pages listed below, or by using the keyword search tool below to find specific information within the annual report.-
 1
1 -
2
-
3
-
4
-
5
-
6
-
7
-
8
-
9
-
10
-
11
-
12
-
13
-
14
-
15
-
16
-
17
-
18
-
19
-
20
-
21
-
22
-
23
-
24
-
25
-
26
-
27
-
28
-
29
-
30
-
31
-
32
-
33
-
34
-
35
-
36
-
37
-
38
-
39
-
40
-
41
-
42
-
43
-
44
-
45
-
46
-
47
-
48
-
49
-
50
-
51
-
52
-
53
-
54
-
55
-
56
-
57
-
 58
58 -
 59
59 -
 60
60 -
 61
61 -
 62
62 -
 63
63 -
 64
64 -
 65
65 -
 66
66 -
 67
67 -
 68
68 -
 69
69 -
 70
70 -
 71
71 -
 72
72 -
 73
73 -
 74
74 -
 75
75 -
 76
76 -
 77
77 -
 78
78 -
79
-
80
-
81
-
82
-
83
-
84
-
85
-
86
-
87
-
88
-
89
-
90
-
91
-
92
-
93
-
94
-
95
-
96
-
97
-
98
-
99
-
100
-
101
-
102
-
103
-
104
-
105
-
106
-
107
-
108
-
109
-
110
-
111
-
112
-
113
-
114
-
115
-
116
-
117
-
118
-
119
-
120
-
121
-
122
-
123
-
124
-
125
-
126
-
127
-
128
-
129
-
130
 |
 |

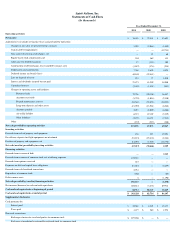
LIQUIDITY AND CAPITAL RESOURCES
Our primary source of liquidity is cash on hand and cash provided by operations, with our primary uses of liquidity being working capital
and capital expenditures.
Our total cash at December 31, 2011 was $343.3 million , an improvement of $ 260.6 million from December 31, 2010 . During 2011, we
completed our IPO, which raised net proceeds of $150.0 million after repayment of debt, payment of transaction expenses and payments of fees
to certain unaffiliated holders of our notes. Additionally, during 2011, the IPO allowed us to amend our agreements with our credit card
processors enabling us to eliminate our restricted cash balance, which was $72.7 million at year-end 2010 , and increase our unrestricted cash
balance.
In prior periods, restricted cash represented cash collateral related to a portion of our obligation to fulfill future flights, or ATL, held by
credit card processors. Our credit card processors have historically required holdbacks (collateral), which we record as restricted cash, when
future air travel and other future services are purchased via credit card transactions. Our restricted cash balance at December 31, 2011 was
eliminated, reflecting a complete release of all holdback requirements by all of our credit card processors provided that we continue to satisfy
certain liquidity and other financial covenants. Failure to meet these covenants would provide the processors the right to reinstate a holdback,
resulting in a commensurate reduction of unrestricted cash that could be material.
In recent years, our short-term capital needs have been funded primarily by cash from operations. Our most significant capital needs are to
fund the acquisition costs of our aircraft. PDPs relating to future deliveries under our agreement with Airbus are required at various times prior
to each delivery date. In 2011 , we paid $53.3 million in PDPs and have $ 91.5 million of PDP's on our balance sheet, representing the amount
we paid since inception, net of returns at the time of financing. Our most significant operating need is the funding of maintenance reserves which
are paid to aircraft lessors to be held as collateral in advance of our performance of major maintenance activities. In 2011 , we paid maintenance
reserves of $ 38.3 million and have $168.8 million ($48.2 million and $ 120.6 million , recorded within other current assets and prepaid aircraft
maintenance to lessors, respectively) on our balance sheet, representing the amount we have paid in reserves since inception, net of
reimbursements and amounts expensed.
We have executed lease agreements for the sale and leaseback for the five A320 aircraft deliveries from our existing order with Airbus
with deliveries scheduled between January and June 2012. We do not have financing commitments in place for 101 of the aircraft currently on
firm order, 26 of which are scheduled for delivery in late 2012 through 2015, and 75 of which are scheduled for delivery from 2016 through
2021. These future aircraft deliveries may be sold and leased back or otherwise financed based on market conditions, our level of liquidity, and
capital market availability. Please see “—Critical Accounting Policies and Estimates—Gains and Losses on Sale and Leaseback.”
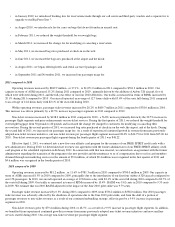
Net Cash Flows Provided By Operating Activities. Operating activities in 2011 provided $171.2 million in cash compared to $27.0 million
in cash generated in 2010 . The increase is primarily due to the release of all our holdbacks by our credit card processors and higher earnings
during 2011 compared to 2010 .
Operating activities in 2010 provided $27.0 million in cash compared to $69.1 million in cash for 2009 . The decrease was mainly due to
lower profitability as a result of higher fuel prices during 2010 compared to 2009 and the effects of the June 2010 pilot strike. Additionally, we
paid $35.7 million and $26.9 million in maintenance reserves, net of reimbursement, to our lessors for 2010 and 2009 , respectively, which we
recorded as prepaid maintenance deposits.
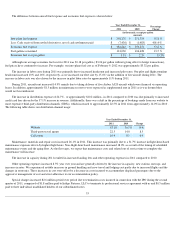
Net Cash Flows Used In Investing Activities. During 2011 , investing activities used $67.2 million , compared to $30.5 million used for
2010 . The increase is mainly related to higher PDPs made period over period due to timing of the delivery schedule for future aircraft, coupled
with slightly higher capital expenditures including a spare engine for which we entered into a sale-lease back transaction during 2011. In
addition, $6.7 million in returned PDPs were received from two completed aircraft sale and leaseback transactions.
During 2010, our investing activities used net cash of $30.5 million, compared to $2.3 million of net cash received during the 2009. During
2010, we paid PDPs, net of refunds, of $25.5 million and had capital expenditures of $5.3 million, offset by $0.3 million of proceeds from the
sale of retired equipment. During 2009, we paid $2.4 million in PDPs, net of refunds, and $14.8 million for capital expenditures, offset by $19.5
million of proceeds from the sale of retired equipment.
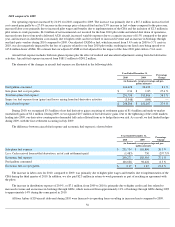
During 2009, we received net cash of $2.3 million from investing activities. We paid $12.0 million for the remaining purchase price on
two engines that we later sold in a sale and leaseback transaction for $18.7 million, we received $0.8 million on the sale of retired equipment,
and we paid $2.4 million in PDPs, net of refunds, and $2.8 million in general capital expenditures.
60