Pottery Barn 2014 Annual Report Download - page 75
Download and view the complete annual report
Please find page 75 of the 2014 Pottery Barn annual report below. You can navigate through the pages in the report by either clicking on the pages listed below, or by using the keyword search tool below to find specific information within the annual report.-
 1
1 -
2
-
3
-
4
-
5
-
6
-
7
-
8
-
9
-
10
-
11
-
12
-
13
-
14
-
15
-
16
-
17
-
18
-
19
-
20
-
21
-
22
-
23
-
24
-
25
-
26
-
27
-
28
-
29
-
30
-
31
-
32
-
33
-
34
-
35
-
36
-
37
-
38
-
39
-
40
-
41
-
42
-
43
-
44
-
45
-
46
-
47
-
48
-
49
-
50
-
51
-
52
-
53
-
54
-
55
-
56
-
57
-
58
-
59
-
60
-
61
-
62
-
63
-
64
-
 65
65 -
 66
66 -
 67
67 -
 68
68 -
 69
69 -
 70
70 -
 71
71 -
 72
72 -
 73
73 -
 74
74 -
 75
75 -
 76
76 -
 77
77 -
 78
78 -
 79
79 -
 80
80 -
 81
81 -
 82
82 -
 83
83 -
 84
84 -
 85
85 -
86
-
87
-
88
-
89
-
90
-
91
-
92
-
93
-
94
-
95
-
96
-
97
-
98
-
99
-
100
-
101
-
102
-
103
-
104
-
105
-
106
-
107
-
108
-
109
-
110
-
111
-
112
-
113
-
114
-
115
-
116
-
117
-
118
-
119
-
120
-
121
-
122
-
123
-
124
-
125
-
126
-
127
-
128
-
129
-
130
-
131
-
132
-
133
-
134
-
135
-
136
-
137
-
138
-
139
-
140
-
141
-
142
-
143
-
144
-
145
-
146
-
147
-
148
-
149
-
150
-
151
-
152
-
153
-
154
-
155
-
156
-
157
-
158
-
159
-
160
-
161
-
162
-
163
-
164
-
165
-
166
-
167
-
168
-
169
-
170
-
171
-
172
-
173
-
174
-
175
-
176
-
177
-
178
-
179
-
180
-
181
-
182
-
183
-
184
-
185
-
186
-
187
-
188
 |
 |

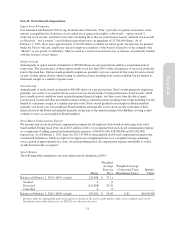
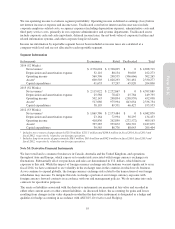
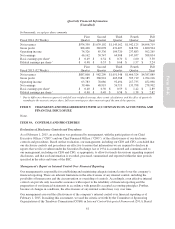
Quarterly Financial Information
(Unaudited)
In thousands, except per share amounts
Fiscal 2014 (52 Weeks)
First
Quarter
Second
Quarter
Third
Quarter
Fourth
Quarter
Full
Year
Net revenues $974,330 $1,039,102 $1,143,162 $1,542,125 $4,698,719
Gross profit 368,408 382,098 431,407 618,591 1,800,504
Operating income 74,326 85,336 104,720 237,883 502,265
Net earnings 46,162 50,747 64,908 147,037 308,854
Basic earnings per share1$ 0.49 $ 0.54 $ 0.70 $ 1.60 $ 3.30
Diluted earnings per share1$ 0.48 $ 0.53 $ 0.68 $ 1.57 $ 3.24
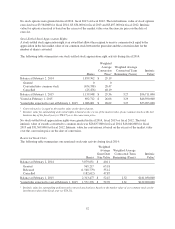
Fiscal 2013 (52 Weeks)
First
Quarter
Second
Quarter
Third
Quarter
Fourth
Quarter
Full
Year
Net revenues $887,808 $ 982,209 $1,051,548 $1,466,324 $4,387,889
Gross profit 334,185 368,924 405,388 595,719 1,704,216
Operating income 63,783 78,086 92,494 217,735 452,098
Net earnings 39,466 48,919 56,719 133,798 278,902
Basic earnings per share1$ 0.40 $ 0.50 $ 0.59 $ 1.42 $ 2.89
Diluted earnings per share1$ 0.40 $ 0.49 $ 0.58 $ 1.38 $ 2.82
1Due to differences between quarterly and full year weighted average share count calculations, and the effect of quarterly
rounding to the nearest cent per share, full year earnings per share may not equal the sum of the quarters.
ITEM 9. CHANGES IN AND DISAGREEMENTS WITH ACCOUNTANTS ON ACCOUNTING AND
FINANCIAL DISCLOSURE
None.
ITEM 9A. CONTROLS AND PROCEDURES
Evaluation of Disclosure Controls and Procedures
As of February 1, 2015, an evaluation was performed by management, with the participation of our Chief
Executive Officer (“CEO”) and our Chief Financial Officer (“CFO”), of the effectiveness of our disclosure
controls and procedures. Based on that evaluation, our management, including our CEO and CFO, concluded that
our disclosure controls and procedures are effective to ensure that information we are required to disclose in
reports that we file or submit under the Securities Exchange Act of 1934 is accumulated and communicated to
our management, including our CEO and CFO, as appropriate, to allow for timely discussions regarding required
disclosures, and that such information is recorded, processed, summarized and reported within the time periods
specified in the rules and forms of the SEC.
Management’s Report on Internal Control Over Financial Reporting
Our management is responsible for establishing and maintaining adequate internal control over the company’s
financial reporting. There are inherent limitations in the effectiveness of any internal control, including the
possibility of human error and the circumvention or overriding of controls. Accordingly, even effective internal
control can provide only reasonable assurance with respect to the reliability of financial reporting and the
preparation of our financial statements in accordance with generally accepted accounting principles. Further,
because of changes in conditions, the effectiveness of any internal control may vary over time.
Our management assessed the effectiveness of the company’s internal control over financial reporting as of
February 1, 2015. In making this assessment, we used the criteria set forth by the Committee of Sponsoring
Organizations of the Treadway Commission (COSO) in Internal Control-Integrated Framework (2013). Based
61
Form 10-K