Pottery Barn 2014 Annual Report Download - page 67
Download and view the complete annual report
Please find page 67 of the 2014 Pottery Barn annual report below. You can navigate through the pages in the report by either clicking on the pages listed below, or by using the keyword search tool below to find specific information within the annual report.-
 1
1 -
2
-
3
-
4
-
5
-
6
-
7
-
8
-
9
-
10
-
11
-
12
-
13
-
14
-
15
-
16
-
17
-
18
-
19
-
20
-
21
-
22
-
23
-
24
-
25
-
26
-
27
-
28
-
29
-
30
-
31
-
32
-
33
-
34
-
35
-
36
-
37
-
38
-
39
-
40
-
41
-
42
-
43
-
44
-
45
-
46
-
47
-
48
-
49
-
50
-
51
-
52
-
53
-
54
-
55
-
56
-
 57
57 -
 58
58 -
 59
59 -
 60
60 -
 61
61 -
 62
62 -
 63
63 -
 64
64 -
 65
65 -
 66
66 -
 67
67 -
 68
68 -
 69
69 -
 70
70 -
 71
71 -
 72
72 -
 73
73 -
 74
74 -
 75
75 -
 76
76 -
 77
77 -
78
-
79
-
80
-
81
-
82
-
83
-
84
-
85
-
86
-
87
-
88
-
89
-
90
-
91
-
92
-
93
-
94
-
95
-
96
-
97
-
98
-
99
-
100
-
101
-
102
-
103
-
104
-
105
-
106
-
107
-
108
-
109
-
110
-
111
-
112
-
113
-
114
-
115
-
116
-
117
-
118
-
119
-
120
-
121
-
122
-
123
-
124
-
125
-
126
-
127
-
128
-
129
-
130
-
131
-
132
-
133
-
134
-
135
-
136
-
137
-
138
-
139
-
140
-
141
-
142
-
143
-
144
-
145
-
146
-
147
-
148
-
149
-
150
-
151
-
152
-
153
-
154
-
155
-
156
-
157
-
158
-
159
-
160
-
161
-
162
-
163
-
164
-
165
-
166
-
167
-
168
-
169
-
170
-
171
-
172
-
173
-
174
-
175
-
176
-
177
-
178
-
179
-
180
-
181
-
182
-
183
-
184
-
185
-
186
-
187
-
188
 |
 |

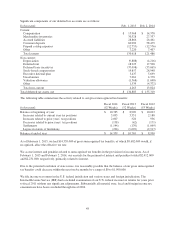
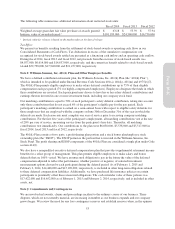
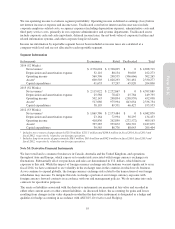
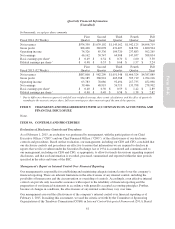
The following table summarizes additional information about restricted stock units:
Fiscal 2014 Fiscal 2013 Fiscal 2012
Weighted average grant date fair value per share of awards granted $ 63.18 $ 53.59 $ 37.94
Intrinsic value of awards released 1$101,189,000 $24,568,000 $16,730,000
1Intrinsic value for releases is based on the market value on the date of release.
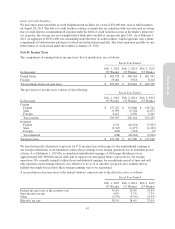
Tax Effect
We present tax benefits resulting from the settlement of stock-based awards as operating cash flows in our
Consolidated Statements of Cash Flows. Tax deductions in excess of the cumulative compensation cost
recognized for stock-based awards settled are presented as a financing cash inflow and an operating cash outflow.
During fiscal 2014, fiscal 2013 and fiscal 2012, net proceeds from the exercise of stock-based awards was
$4,077,000, $6,614,000 and $14,637,000, respectively, and the current tax benefit related to stock-based awards
totaled $52,798,000, $17,940,000 and $21,477,000, respectively.
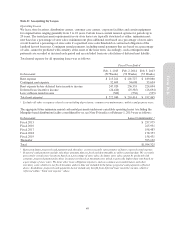
Note I: Williams-Sonoma, Inc. 401(k) Plan and Other Employee Benefits
We have a defined contribution retirement plan, the Williams-Sonoma, Inc. 401(k) Plan (the “401(k) Plan”),
which is intended to be qualified under Internal Revenue Code Sections 401(a), 401(k), 401(m) and 4975(e)(7).
The 401(k) Plan permits eligible employees to make salary deferral contributions up to 75% of their eligible
compensation each pay period (7% for highly-compensated employees). Employees designate the funds in which
their contributions are invested. Each participant may choose to have his or her salary deferral contributions and
earnings thereon invested in one or more investment funds, including our company stock fund.
Our matching contribution is equal to 50% of each participant’s salary deferral contribution, taking into account
only those contributions that do not exceed 6% of the participant’s eligible pay for the pay period. Each
participant’s matching contribution is earned on a semi-annual basis with respect to eligible salary deferrals for
those employees that are employed with the company on June 30th or December 31st of the year in which the
deferrals are made. Each associate must complete one year of service prior to receiving company matching
contributions. For the first five years of the participant’s employment, all matching contributions vest at the rate
of 20% per year of service, measuring service from the participant’s hire date. Thereafter, all matching
contributions vest immediately. Our contributions to the plan were $6,038,000, $5,538,000 and $5,517,000 in
fiscal 2014, fiscal 2013 and fiscal 2012, respectively.
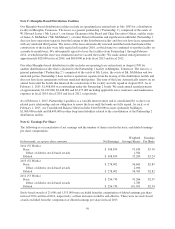
The 401(k) Plan consists of two parts: a profit sharing plan portion and a stock bonus plan/employee stock
ownership plan (the “ESOP”). The ESOP portion is the portion that is invested in the Williams-Sonoma, Inc.
Stock Fund. The profit sharing and ESOP components of the 401(k) Plan are considered a single plan under Code
section 414(l).
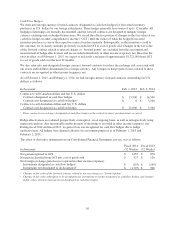
We also have a nonqualified executive deferred compensation plan that provides supplemental retirement income
benefits for a select group of management. This plan permits eligible employees to make salary and bonus
deferrals that are 100% vested. We have an unsecured obligation to pay in the future the value of the deferred
compensation adjusted to reflect the performance, whether positive or negative, of selected investment
measurement options chosen by each participant during the deferral period. As of February 1, 2015 and
February 2, 2014, $14,446,000 and $15,190,000, respectively, is included in other long-term obligations related
to these deferred compensation liabilities. Additionally, we have purchased life insurance policies on certain
participants to potentially offset these unsecured obligations. The cash surrender value of these policies was
$17,422,000 and $16,652,000 as of February 1, 2015 and February 2, 2014, respectively, and is included in other
assets, net.
Note J: Commitments and Contingencies
We are involved in lawsuits, claims and proceedings incident to the ordinary course of our business. These
disputes, which are not currently material, are increasing in number as our business expands and our company
grows larger. We review the need for any loss contingency reserves and establish reserves when, in the opinion
53
Form 10-K