Pottery Barn 2014 Annual Report Download - page 45
Download and view the complete annual report
Please find page 45 of the 2014 Pottery Barn annual report below. You can navigate through the pages in the report by either clicking on the pages listed below, or by using the keyword search tool below to find specific information within the annual report.-
 1
1 -
2
-
3
-
4
-
5
-
6
-
7
-
8
-
9
-
10
-
11
-
12
-
13
-
14
-
15
-
16
-
17
-
18
-
19
-
20
-
21
-
22
-
23
-
24
-
25
-
26
-
27
-
28
-
29
-
30
-
31
-
32
-
33
-
34
-
 35
35 -
 36
36 -
 37
37 -
 38
38 -
 39
39 -
 40
40 -
 41
41 -
 42
42 -
 43
43 -
 44
44 -
 45
45 -
 46
46 -
 47
47 -
 48
48 -
 49
49 -
 50
50 -
 51
51 -
 52
52 -
 53
53 -
 54
54 -
 55
55 -
56
-
57
-
58
-
59
-
60
-
61
-
62
-
63
-
64
-
65
-
66
-
67
-
68
-
69
-
70
-
71
-
72
-
73
-
74
-
75
-
76
-
77
-
78
-
79
-
80
-
81
-
82
-
83
-
84
-
85
-
86
-
87
-
88
-
89
-
90
-
91
-
92
-
93
-
94
-
95
-
96
-
97
-
98
-
99
-
100
-
101
-
102
-
103
-
104
-
105
-
106
-
107
-
108
-
109
-
110
-
111
-
112
-
113
-
114
-
115
-
116
-
117
-
118
-
119
-
120
-
121
-
122
-
123
-
124
-
125
-
126
-
127
-
128
-
129
-
130
-
131
-
132
-
133
-
134
-
135
-
136
-
137
-
138
-
139
-
140
-
141
-
142
-
143
-
144
-
145
-
146
-
147
-
148
-
149
-
150
-
151
-
152
-
153
-
154
-
155
-
156
-
157
-
158
-
159
-
160
-
161
-
162
-
163
-
164
-
165
-
166
-
167
-
168
-
169
-
170
-
171
-
172
-
173
-
174
-
175
-
176
-
177
-
178
-
179
-
180
-
181
-
182
-
183
-
184
-
185
-
186
-
187
-
188
 |
 |

and other insurance programs, were replaced with standby letters of credit. As of February 1, 2015, a total of
$14,760,000 in issued but undrawn standby letters of credit was outstanding under the credit facility.
Additionally, as of February 1, 2015, we had three unsecured letter of credit reimbursement facilities, which were
amended during the year, for a total of $70,000,000, of which an aggregate of $9,651,000 was outstanding. These
letter of credit facilities represent only a future commitment to fund inventory purchases to which we had not
taken legal title. We are currently in compliance with all of our financial covenants under the credit facility and,
based on our current projections, we expect to remain in compliance throughout fiscal 2015. We believe our cash
on hand, in addition to our available credit facilities, will provide adequate liquidity for our business operations
over the next 12 months.
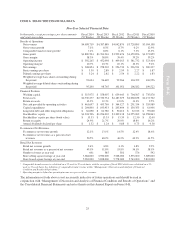
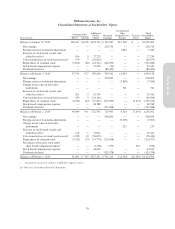
Cash Flows from Operating Activities
For fiscal 2014, net cash provided by operating activities was $461,697,000 compared to $453,769,000 in fiscal
2013. For fiscal 2014, net cash provided by operating activities was primarily attributable to net earnings
adjusted for non-cash items and an increase in customer deposits, partially offset by an increase in merchandise
inventories. This represents an increase in net cash provided compared to fiscal 2013 primarily due to a decrease
in inventory purchases and an increase in net earnings adjusted for non-cash items, partially offset by the timing
of payments associated with accounts payable and accrued liabilities.
For fiscal 2013, net cash provided by operating activities was $453,769,000 compared to $364,127,000 in fiscal
2012. For fiscal 2013, net cash provided by operating activities was primarily attributable to an increase in net
earnings adjusted for non-cash items and an increase in accounts payable and accrued liabilities, partially offset
by an increase in merchandise inventories. This represents an increase in net cash provided compared to fiscal
2012 primarily due to the timing of payments associated with accounts payable and accrued liabilities, partially
offset by an increase in inventory purchases.
Cash Flows from Investing Activities
For fiscal 2014, net cash used in investing activities was $188,600,000 compared to $190,624,000 for fiscal
2013, and was primarily attributable to purchases of property and equipment. Net cash used compared to fiscal
2013 decreased primarily due to the redemption of restricted cash deposits, partially offset by an increase in
purchases of property and equipment.
For fiscal 2013, net cash used in investing activities was $190,624,000 compared to $206,815,000 for fiscal
2012, and was primarily attributable to purchases of property and equipment. Net cash used compared to fiscal
2012 decreased primarily due to a decrease in purchases of property and equipment.
Cash Flows from Financing Activities
For fiscal 2014, net cash used in financing activities was $379,020,000 compared to $355,376,000 in fiscal 2013.
For fiscal 2014, net cash used in financing activities was primarily attributable to the repurchase of common
stock of $224,377,000 and the payment of dividends of $125,758,000. Net cash used compared to fiscal 2013
increased primarily due to an increase in tax withholding payments related to stock-based awards.
For fiscal 2013, net cash used in financing activities was $355,376,000 compared to $236,445,000 in fiscal 2012.
For fiscal 2013, net cash used in financing activities was primarily attributable to the repurchase of common
stock of $239,274,000 and the payment of dividends of $111,581,000. Net cash used compared to fiscal 2012
increased primarily due to an increase in the repurchase of common stock.
Dividends
See section titled Dividends within Part II, Item 5 of this Annual Report on Form 10-K for further information.
Stock Repurchase Programs
See section titled Stock Repurchase Programs within Part II, Item 5 of this Annual Report on Form 10-K for
further information.
31
Form 10-K