Pottery Barn 2014 Annual Report Download - page 41
Download and view the complete annual report
Please find page 41 of the 2014 Pottery Barn annual report below. You can navigate through the pages in the report by either clicking on the pages listed below, or by using the keyword search tool below to find specific information within the annual report.-
 1
1 -
2
-
3
-
4
-
5
-
6
-
7
-
8
-
9
-
10
-
11
-
12
-
13
-
14
-
15
-
16
-
17
-
18
-
19
-
20
-
21
-
22
-
23
-
24
-
25
-
26
-
27
-
28
-
29
-
30
-
 31
31 -
 32
32 -
 33
33 -
 34
34 -
 35
35 -
 36
36 -
 37
37 -
 38
38 -
 39
39 -
 40
40 -
 41
41 -
 42
42 -
 43
43 -
 44
44 -
 45
45 -
 46
46 -
 47
47 -
 48
48 -
 49
49 -
 50
50 -
 51
51 -
52
-
53
-
54
-
55
-
56
-
57
-
58
-
59
-
60
-
61
-
62
-
63
-
64
-
65
-
66
-
67
-
68
-
69
-
70
-
71
-
72
-
73
-
74
-
75
-
76
-
77
-
78
-
79
-
80
-
81
-
82
-
83
-
84
-
85
-
86
-
87
-
88
-
89
-
90
-
91
-
92
-
93
-
94
-
95
-
96
-
97
-
98
-
99
-
100
-
101
-
102
-
103
-
104
-
105
-
106
-
107
-
108
-
109
-
110
-
111
-
112
-
113
-
114
-
115
-
116
-
117
-
118
-
119
-
120
-
121
-
122
-
123
-
124
-
125
-
126
-
127
-
128
-
129
-
130
-
131
-
132
-
133
-
134
-
135
-
136
-
137
-
138
-
139
-
140
-
141
-
142
-
143
-
144
-
145
-
146
-
147
-
148
-
149
-
150
-
151
-
152
-
153
-
154
-
155
-
156
-
157
-
158
-
159
-
160
-
161
-
162
-
163
-
164
-
165
-
166
-
167
-
168
-
169
-
170
-
171
-
172
-
173
-
174
-
175
-
176
-
177
-
178
-
179
-
180
-
181
-
182
-
183
-
184
-
185
-
186
-
187
-
188
 |
 |

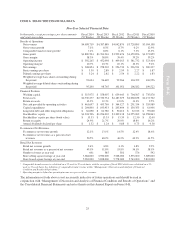
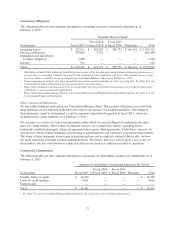
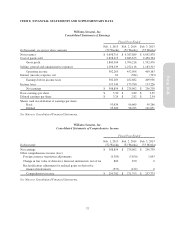
Results of Operations
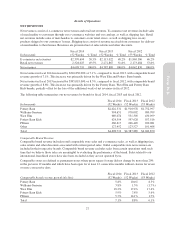
NET REVENUES
Net revenues consist of e-commerce net revenues and retail net revenues. E-commerce net revenues include sales
of merchandise to customers through our e-commerce websites and our catalogs, as well as shipping fees. Retail
net revenues include sales of merchandise to customers at our retail stores, as well as shipping fees on any
products shipped to our customers’ homes. Shipping fees consist of revenue received from customers for delivery
of merchandise to their homes. Revenues are presented net of sales returns and other discounts.
In thousands
Fiscal 2014
(52 Weeks) % Total
Fiscal 2013
(52 Weeks) % Total
Fiscal 2012
(53 Weeks) % Total
E-commerce net revenues $2,370,694 50.5% $2,115,022 48.2% $1,869,386 46.2%
Retail net revenues 2,328,025 49.5% 2,272,867 51.8% 2,173,484 53.8%
Net revenues $4,698,719 100.0% $4,387,889 100.0% $4,042,870 100.0%
Net revenues in fiscal 2014 increased by $310,830,000, or 7.1%, compared to fiscal 2013, with comparable brand
revenue growth of 7.1%. This increase was primarily driven by the West Elm and Pottery Barn brands.
Net revenues in fiscal 2013 increased by $345,019,000, or 8.5%, compared to fiscal 2012, with comparable brand
revenue growth of 8.8%. This increase was primarily driven by the Pottery Barn, West Elm and Pottery Barn
Kids brands, partially offset by the loss of the additional week of net revenues in fiscal 2012.
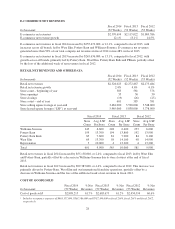
The following table summarizes our net revenues by brand for fiscal 2014, fiscal 2013 and fiscal 2012.
In thousands
Fiscal 2014
(52 Weeks)
Fiscal 2013
(52 Weeks)
Fiscal 2012
(53 Weeks)
Pottery Barn $2,022,331 $1,910,978 $1,752,997
Williams-Sonoma 994,651 978,002 980,709
West Elm 669,074 531,305 430,099
Pottery Barn Kids 624,594 597,628 557,516
PBteen 260,617 246,449 220,081
Other 127,452 123,527 101,468
Total $4,698,719 $4,387,889 $4,042,870
Comparable Brand Revenue
Comparable brand revenue includes retail comparable store sales and e-commerce sales, as well as shipping fees,
sales returns and other discounts associated with current period sales. Outlet comparable store net revenues are
included in their respective brands. Comparable brand revenue excludes sales from certain operations until such
time that we believe those sales are meaningful to evaluating the performance of the brand. Sales related to our
international franchised stores have also been excluded as they are not operated by us.
Comparable stores are defined as permanent stores where gross square footage did not change by more than 20%
in the previous 12 months and which have been open for at least 12 consecutive months without closure for seven
or more consecutive days.
Comparable brand revenue growth (decline)
Fiscal 2014
(52 Weeks)
Fiscal 2013
(52 Weeks)
Fiscal 2012
(53 Weeks)
Pottery Barn 5.8% 10.4% 8.5%
Williams-Sonoma 3.8% 1.5% (1.7%)
West Elm 18.2% 17.4% 17.4%
Pottery Barn Kids 5.9% 7.8% 5.6%
PBteen 5.7% 14.1% 1.7%
Total 7.1% 8.8% 6.1%
27
Form 10-K