Pottery Barn 2014 Annual Report Download - page 69
Download and view the complete annual report
Please find page 69 of the 2014 Pottery Barn annual report below. You can navigate through the pages in the report by either clicking on the pages listed below, or by using the keyword search tool below to find specific information within the annual report.-
 1
1 -
2
-
3
-
4
-
5
-
6
-
7
-
8
-
9
-
10
-
11
-
12
-
13
-
14
-
15
-
16
-
17
-
18
-
19
-
20
-
21
-
22
-
23
-
24
-
25
-
26
-
27
-
28
-
29
-
30
-
31
-
32
-
33
-
34
-
35
-
36
-
37
-
38
-
39
-
40
-
41
-
42
-
43
-
44
-
45
-
46
-
47
-
48
-
49
-
50
-
51
-
52
-
53
-
54
-
55
-
56
-
57
-
58
-
 59
59 -
 60
60 -
 61
61 -
 62
62 -
 63
63 -
 64
64 -
 65
65 -
 66
66 -
 67
67 -
 68
68 -
 69
69 -
 70
70 -
 71
71 -
 72
72 -
 73
73 -
 74
74 -
 75
75 -
 76
76 -
 77
77 -
 78
78 -
 79
79 -
80
-
81
-
82
-
83
-
84
-
85
-
86
-
87
-
88
-
89
-
90
-
91
-
92
-
93
-
94
-
95
-
96
-
97
-
98
-
99
-
100
-
101
-
102
-
103
-
104
-
105
-
106
-
107
-
108
-
109
-
110
-
111
-
112
-
113
-
114
-
115
-
116
-
117
-
118
-
119
-
120
-
121
-
122
-
123
-
124
-
125
-
126
-
127
-
128
-
129
-
130
-
131
-
132
-
133
-
134
-
135
-
136
-
137
-
138
-
139
-
140
-
141
-
142
-
143
-
144
-
145
-
146
-
147
-
148
-
149
-
150
-
151
-
152
-
153
-
154
-
155
-
156
-
157
-
158
-
159
-
160
-
161
-
162
-
163
-
164
-
165
-
166
-
167
-
168
-
169
-
170
-
171
-
172
-
173
-
174
-
175
-
176
-
177
-
178
-
179
-
180
-
181
-
182
-
183
-
184
-
185
-
186
-
187
-
188
 |
 |

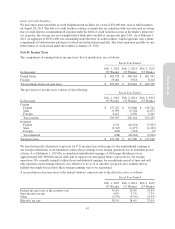
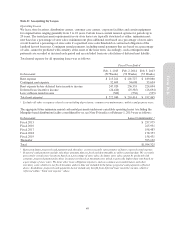
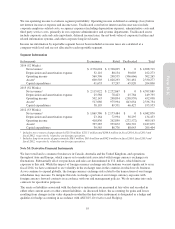
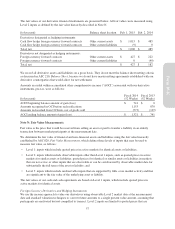
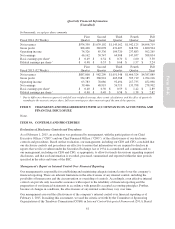
We use operating income to evaluate segment profitability. Operating income is defined as earnings (loss) before
net interest income or expense and income taxes. Unallocated costs before interest and income taxes include
corporate employee-related costs, occupancy expenses (including depreciation expense), administrative costs and
third party service costs, primarily in our corporate administrative and systems departments. Unallocated assets
include corporate cash and cash equivalents, deferred income taxes, the net book value of corporate facilities and
related information systems, and other corporate long-lived assets.
Income tax information by reportable segment has not been included as income taxes are calculated at a
company-wide level and are not allocated to each reportable segment.
Segment Information
In thousands E-commerce Retail Unallocated Total
2014 (52 Weeks)
Net revenues1$ 2,370,694 $ 2,328,025 $ 0 $ 4,698,719
Depreciation and amortization expense 32,116 80,154 50,003 162,273
Operating income 560,396 248,535 (306,666) 502,265
Assets2600,503 1,028,293 701,481 2,330,277
Capital expenditures 41,633 97,247 65,920 204,800
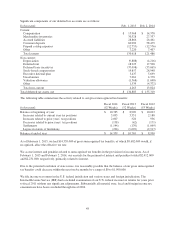
2013 (52 Weeks)
Net revenues1$ 2,115,022 $ 2,272,867 $ 0 $ 4,387,889
Depreciation and amortization expense 25,588 78,423 45,784 149,795
Operating income 502,143 248,894 (298,939) 452,098
Assets2517,086 975,994 843,654 2,336,734
Capital expenditures 38,195 89,331 66,427 193,953
2012 (53 Weeks)
Net revenues1$ 1,869,386 $ 2,173,484 $ 0 $ 4,042,870
Depreciation and amortization expense 23,164 72,994 38,295 134,453
Operating income 418,836 262,899 (272,572) 409,163
Assets2397,285 939,672 850,722 2,187,679
Capital expenditures 30,585 86,776 88,043 205,404
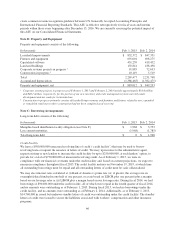
1Includes net revenues of approximately $235.8 million, $215.5 million and $166.6 million in fiscal 2014, fiscal 2013 and
fiscal 2012, respectively, related to our foreign operations.
2Includes long-term assets of approximately $58.3 million, $61.4 million and $42.6 million in fiscal 2014, fiscal 2013 and
fiscal 2012, respectively, related to our foreign operations.
Note M: Derivative Financial Instruments
We have retail and e-commerce businesses in Canada, Australia and the United Kingdom, and operations
throughout Asia and Europe, which expose us to market risk associated with foreign currency exchange rate
fluctuations. Substantially all of our purchases and sales are denominated in U.S. dollars, which limits our
exposure to this risk. While the impact of foreign currency exchange rate fluctuations was not significant to us in
fiscal 2014, we have continued to see volatility in the exchange rates in the countries in which we do business.
As we continue to expand globally, the foreign currency exchange risk related to the transactions of our foreign
subsidiaries may increase. To mitigate this risk, we hedge a portion of our foreign currency exposure with
foreign currency forward contracts in accordance with our risk management policies. We do not enter into such
contracts for speculative purposes.
The assets or liabilities associated with the derivative instruments are measured at fair value and recorded in
either other current assets or other current liabilities. As discussed below, the accounting for gains and losses
resulting from changes in fair value depends on whether the derivative instrument is designated as a hedge and
qualifies for hedge accounting in accordance with ASC 815, Derivatives and Hedging.
55
Form 10-K