Pottery Barn 2014 Annual Report Download - page 133
Download and view the complete annual report
Please find page 133 of the 2014 Pottery Barn annual report below. You can navigate through the pages in the report by either clicking on the pages listed below, or by using the keyword search tool below to find specific information within the annual report.-
 1
1 -
 2
2 -
 3
3 -
 4
4 -
 5
5 -
 6
6 -
 7
7 -
 8
8 -
 9
9 -
 10
10 -
 11
11 -
 12
12 -
 13
13 -
 14
14 -
 15
15 -
 16
16 -
 17
17 -
 18
18 -
 19
19 -
 20
20 -
 21
21 -
 22
22 -
 23
23 -
 24
24 -
 25
25 -
 26
26 -
 27
27 -
 28
28 -
 29
29 -
 30
30 -
 31
31 -
 32
32 -
 33
33 -
 34
34 -
 35
35 -
 36
36 -
 37
37 -
 38
38 -
 39
39 -
 40
40 -
 41
41 -
 42
42 -
 43
43 -
 44
44 -
 45
45 -
 46
46 -
 47
47 -
 48
48 -
 49
49 -
 50
50 -
 51
51 -
 52
52 -
 53
53 -
 54
54 -
 55
55 -
 56
56 -
 57
57 -
 58
58 -
 59
59 -
 60
60 -
 61
61 -
 62
62 -
 63
63 -
 64
64 -
 65
65 -
 66
66 -
 67
67 -
 68
68 -
 69
69 -
 70
70 -
 71
71 -
 72
72 -
 73
73 -
 74
74 -
 75
75 -
 76
76 -
 77
77 -
 78
78 -
 79
79 -
 80
80 -
 81
81 -
 82
82 -
 83
83 -
 84
84 -
 85
85 -
 86
86 -
 87
87 -
 88
88 -
 89
89 -
 90
90 -
 91
91 -
 92
92 -
 93
93 -
 94
94 -
 95
95 -
 96
96 -
 97
97 -
 98
98 -
 99
99 -
 100
100 -
 101
101 -
 102
102 -
 103
103 -
 104
104 -
 105
105 -
 106
106 -
 107
107 -
 108
108 -
 109
109 -
 110
110 -
 111
111 -
 112
112 -
 113
113 -
 114
114 -
 115
115 -
 116
116 -
 117
117 -
 118
118 -
 119
119 -
 120
120 -
 121
121 -
 122
122 -
 123
123 -
 124
124 -
 125
125 -
 126
126 -
 127
127 -
 128
128 -
 129
129 -
 130
130 -
 131
131 -
 132
132 -
 133
133 -
 134
134 -
 135
135 -
 136
136 -
 137
137 -
 138
138 -
 139
139 -
 140
140 -
 141
141 -
 142
142 -
 143
143 -
 144
144 -
 145
145 -
 146
146 -
 147
147 -
 148
148 -
 149
149 -
 150
150 -
 151
151 -
 152
152 -
 153
153 -
 154
154 -
 155
155 -
 156
156 -
 157
157 -
 158
158 -
 159
159 -
 160
160 -
 161
161 -
 162
162 -
 163
163 -
 164
164 -
 165
165 -
 166
166 -
 167
167 -
 168
168 -
 169
169 -
 170
170 -
 171
171 -
 172
172 -
 173
173 -
 174
174 -
 175
175 -
 176
176 -
 177
177 -
 178
178 -
 179
179 -
 180
180 -
 181
181 -
 182
182 -
 183
183 -
 184
184 -
 185
185 -
 186
186 -
 187
187 -
 188
188
 |
 |
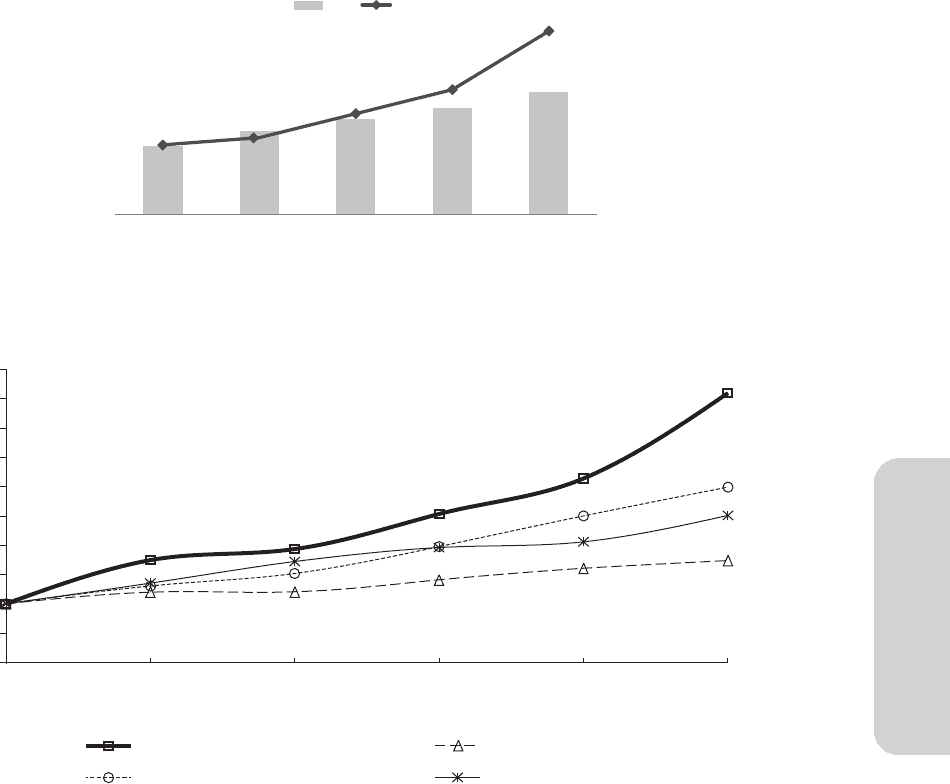
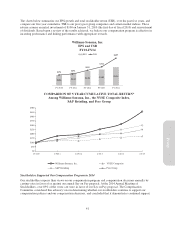
The charts below summarize our EPS growth and total stockholder return (TSR), over the past five years, and
compare our five-year cumulative TSR to our proxy peer group companies and certain market indices. These
returns assume an initial investment of $100 on January 31, 2010 (the first day of fiscal 2010) and reinvestment
of dividends. Based upon a review of the results achieved, we believe our compensation program is effective in
incenting performance and linking performance with appropriate rewards.
$1.83 $2.22 $2.54 $2.82 $3.24
$174 $192
$252
$312
$457
FY 2010 FY 2011 FY 2012 FY 2013 FY 2014
Williams-Sonoma, Inc.
EPS and TSR
FY10-FY14
EPS TSR
1/31/10 1/30/11 1/29/12 2/3/13 2/1/152/2/14
$0
$100
$50
$150
$200
$250
$300
$350
$400
$450
$500
Williams-Sonoma, Inc. NYSE Composite
S&P Retailing Peer Group
COMPARISON OF 5 YEAR CUMULATIVE TOTAL RETURN*
Among Williams-Sonoma, Inc., the NYSE Composite Index,
S&P Retailing, and Peer Group
Stockholders Supported Our Compensation Program in 2014
Our stockholders express their views on our compensation program and compensation decisions annually by
casting votes in favor of or against our annual Say on Pay proposal. At the 2014 Annual Meeting of
Stockholders, over 89% of the votes cast were in favor of our Say on Pay proposal. The Compensation
Committee considered this advisory vote in determining whether our stockholders continue to support our
compensation policies and our compensation decisions, and concluded that it demonstrates continued support.
41
Proxy
