Pottery Barn 2014 Annual Report Download - page 66
Download and view the complete annual report
Please find page 66 of the 2014 Pottery Barn annual report below. You can navigate through the pages in the report by either clicking on the pages listed below, or by using the keyword search tool below to find specific information within the annual report.-
 1
1 -
2
-
3
-
4
-
5
-
6
-
7
-
8
-
9
-
10
-
11
-
12
-
13
-
14
-
15
-
16
-
17
-
18
-
19
-
20
-
21
-
22
-
23
-
24
-
25
-
26
-
27
-
28
-
29
-
30
-
31
-
32
-
33
-
34
-
35
-
36
-
37
-
38
-
39
-
40
-
41
-
42
-
43
-
44
-
45
-
46
-
47
-
48
-
49
-
50
-
51
-
52
-
53
-
54
-
55
-
 56
56 -
 57
57 -
 58
58 -
 59
59 -
 60
60 -
 61
61 -
 62
62 -
 63
63 -
 64
64 -
 65
65 -
 66
66 -
 67
67 -
 68
68 -
 69
69 -
 70
70 -
 71
71 -
 72
72 -
 73
73 -
 74
74 -
 75
75 -
 76
76 -
77
-
78
-
79
-
80
-
81
-
82
-
83
-
84
-
85
-
86
-
87
-
88
-
89
-
90
-
91
-
92
-
93
-
94
-
95
-
96
-
97
-
98
-
99
-
100
-
101
-
102
-
103
-
104
-
105
-
106
-
107
-
108
-
109
-
110
-
111
-
112
-
113
-
114
-
115
-
116
-
117
-
118
-
119
-
120
-
121
-
122
-
123
-
124
-
125
-
126
-
127
-
128
-
129
-
130
-
131
-
132
-
133
-
134
-
135
-
136
-
137
-
138
-
139
-
140
-
141
-
142
-
143
-
144
-
145
-
146
-
147
-
148
-
149
-
150
-
151
-
152
-
153
-
154
-
155
-
156
-
157
-
158
-
159
-
160
-
161
-
162
-
163
-
164
-
165
-
166
-
167
-
168
-
169
-
170
-
171
-
172
-
173
-
174
-
175
-
176
-
177
-
178
-
179
-
180
-
181
-
182
-
183
-
184
-
185
-
186
-
187
-
188
 |
 |

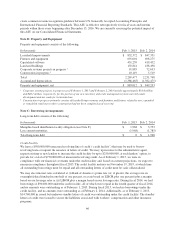
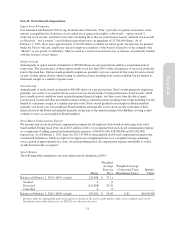
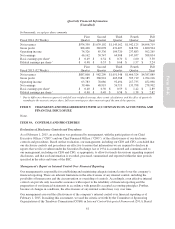
No stock options were granted in fiscal 2014, fiscal 2013 or fiscal 2012. The total intrinsic value of stock options
exercised was $3,564,000 for fiscal 2014, $3,834,000 for fiscal 2013 and $5,497,000 for fiscal 2012. Intrinsic
value for options exercised is based on the excess of the market value over the exercise price on the date of
exercise.
Stock-Settled Stock Appreciation Rights
A stock-settled stock appreciation right is an award that allows the recipient to receive common stock equal to the
appreciation in the fair market value of our common stock between the grant date and the conversion date for the
number of shares converted.
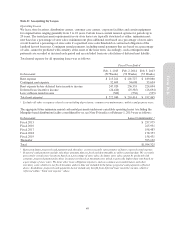
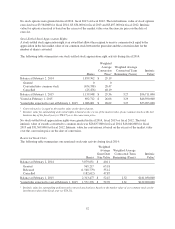
The following table summarizes our stock-settled stock appreciation right activity during fiscal 2014:
Shares
Weighted
Average
Conversion
Price1
Weighted Average
Contractual Term
Remaining (Years)
Intrinsic
Value2
Balance at February 2, 2014 1,859,762 $ 29.19
Granted
00
Converted into common stock (674,338) 28.47
Cancelled (25,476) 40.19
Balance at February 1, 2015 1,159,948 $ 29.36 3.27 $56,711,000
Vested at February 1, 2015 892,712 $ 26.06 3.29 $46,590,000
Vested plus expected to vest at February 1, 2015 1,086,001 $ 28.62 3.27 $53,903,000
1Conversion price is equal to the market value on the date of grant.
2Intrinsic value for outstanding and vested rights is based on the excess of the market value of our common stock on the last
business day of the fiscal year (or $78.25) over the conversion price.
No stock-settled stock appreciation rights were granted in fiscal 2014, fiscal 2013 or fiscal 2012. The total
intrinsic value of awards converted to common stock was $26,837,000 for fiscal 2014, $18,046,000 for fiscal
2013 and $31,569,000 for fiscal 2012. Intrinsic value for conversions is based on the excess of the market value
over the conversion price on the date of conversion.
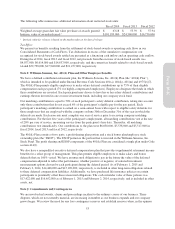
Restricted Stock Units
The following table summarizes our restricted stock unit activity during fiscal 2014:
Shares
Weighted
Average
Grant Date
Fair Value
Weighted Average
Contractual Term
Remaining (Years)
Intrinsic
Value1
Balance at February 2, 2014 3,079,651 $ 40.11
Granted
965,217 63.18
Released (1,548,779) 35.12
Cancelled (182,612) 47.87
Balance at February 1, 2015 2,313,477 $ 52.47 2.52 $181,030,000
Vested plus expected to vest at February 1, 2015 1,571,376 $ 52.70 2.61 $122,960,000
1Intrinsic value for outstanding and unvested restricted stock units is based on the market value of our common stock on the
last business day of the fiscal year (or $78.25).
52