Pottery Barn 2014 Annual Report Download - page 58
Download and view the complete annual report
Please find page 58 of the 2014 Pottery Barn annual report below. You can navigate through the pages in the report by either clicking on the pages listed below, or by using the keyword search tool below to find specific information within the annual report.-
 1
1 -
2
-
3
-
4
-
5
-
6
-
7
-
8
-
9
-
10
-
11
-
12
-
13
-
14
-
15
-
16
-
17
-
18
-
19
-
20
-
21
-
22
-
23
-
24
-
25
-
26
-
27
-
28
-
29
-
30
-
31
-
32
-
33
-
34
-
35
-
36
-
37
-
38
-
39
-
40
-
41
-
42
-
43
-
44
-
45
-
46
-
47
-
 48
48 -
 49
49 -
 50
50 -
 51
51 -
 52
52 -
 53
53 -
 54
54 -
 55
55 -
 56
56 -
 57
57 -
 58
58 -
 59
59 -
 60
60 -
 61
61 -
 62
62 -
 63
63 -
 64
64 -
 65
65 -
 66
66 -
 67
67 -
 68
68 -
69
-
70
-
71
-
72
-
73
-
74
-
75
-
76
-
77
-
78
-
79
-
80
-
81
-
82
-
83
-
84
-
85
-
86
-
87
-
88
-
89
-
90
-
91
-
92
-
93
-
94
-
95
-
96
-
97
-
98
-
99
-
100
-
101
-
102
-
103
-
104
-
105
-
106
-
107
-
108
-
109
-
110
-
111
-
112
-
113
-
114
-
115
-
116
-
117
-
118
-
119
-
120
-
121
-
122
-
123
-
124
-
125
-
126
-
127
-
128
-
129
-
130
-
131
-
132
-
133
-
134
-
135
-
136
-
137
-
138
-
139
-
140
-
141
-
142
-
143
-
144
-
145
-
146
-
147
-
148
-
149
-
150
-
151
-
152
-
153
-
154
-
155
-
156
-
157
-
158
-
159
-
160
-
161
-
162
-
163
-
164
-
165
-
166
-
167
-
168
-
169
-
170
-
171
-
172
-
173
-
174
-
175
-
176
-
177
-
178
-
179
-
180
-
181
-
182
-
183
-
184
-
185
-
186
-
187
-
188
 |
 |

and record the difference between rent expense and the amount currently payable as deferred rent. Deferred lease
incentives include construction allowances received from landlords, which are amortized on a straight-line basis
over the lease term, including the construction period.
Fair Value of Financial Instruments
The carrying values of cash and cash equivalents, restricted cash, accounts receivable, accounts payable and debt
approximate their estimated fair values. We use derivative instruments to hedge against foreign currency
exchange rate fluctuations. The assets or liabilities associated with our derivative financial instruments are
recorded at fair value in either other current assets or other current liabilities. The fair value of our foreign
currency derivative instruments is measured using the income approach whereby we use observable market data
at the measurement date and standard valuation techniques to convert future amounts to a single present value
amount. These observable inputs include spot rates, forward rates, interest rates and credit derivative market rates
(refer to Notes M and N for additional information).
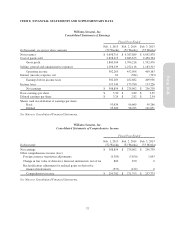
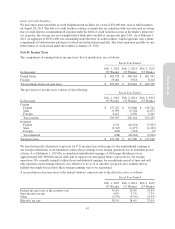
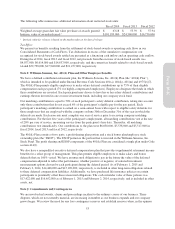
Revenue Recognition
We recognize revenues and the related cost of goods sold (including shipping costs) at the time the products are
delivered to our customers. Revenue is recognized for retail sales (excluding home-delivered merchandise) at the
point of sale in the store and, for home-delivered merchandise and e-commerce sales, when the merchandise is
delivered to the customer. Discounts provided to customers are accounted for as a reduction of sales. We record a
reserve for estimated product returns in each reporting period. Shipping and handling fees charged to the
customer are recognized as revenue at the time the products are delivered to the customer. Revenues are
presented net of any taxes collected from customers and remitted to governmental authorities.
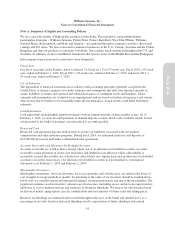
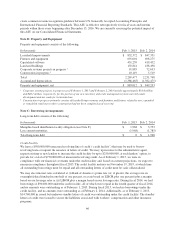
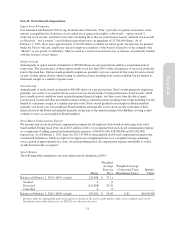
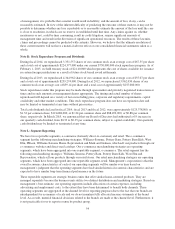
Sales Returns Reserve
Our customers may return purchased items for an exchange or refund. We record a reserve for estimated product
returns, net of cost of goods sold, based on historical return trends together with current product sales
performance. A summary of activity in our sales returns reserve is as follows:
In thousands
Fiscal 20141
(52 Weeks)
Fiscal 20131
(52 Weeks)
Fiscal 20121
(53 Weeks)
Balance at beginning of year $ 15,954 $ 14,397 $ 14,151
Provision for sales returns 311,911 293,929 270,156
Actual sales returns (313,083) (292,372) (269,910)
Balance at end of year $ 14,782 $ 15,954 $ 14,397
1Amounts are shown net of cost of goods sold.
Vendor Allowances
We receive allowances or credits from certain vendors for volume rebates. We treat such volume rebates as an
offset to the cost of the product or services provided at the time the expense is recorded. These allowances and
credits received are recorded in both cost of goods sold and in selling, general and administrative expenses.
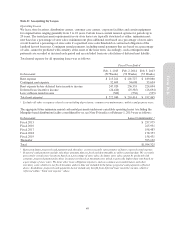
Cost of Goods Sold
Cost of goods sold includes cost of goods, occupancy expenses and shipping costs. Cost of goods consists of cost
of merchandise, inbound freight expenses, freight-to-store expenses and other inventory related costs such as
shrinkage, damages and replacements. Occupancy expenses consist of rent, depreciation and other occupancy
costs, including common area maintenance, property taxes and utilities. Shipping costs consist of third party
delivery services and shipping materials.
Selling, General and Administrative Expenses
Selling, general and administrative expenses consist of non-occupancy related costs associated with our retail
stores, distribution warehouses, customer care centers, supply chain operations (buying, receiving and inspection)
44