Pottery Barn 2014 Annual Report Download - page 44
Download and view the complete annual report
Please find page 44 of the 2014 Pottery Barn annual report below. You can navigate through the pages in the report by either clicking on the pages listed below, or by using the keyword search tool below to find specific information within the annual report.-
 1
1 -
2
-
3
-
4
-
5
-
6
-
7
-
8
-
9
-
10
-
11
-
12
-
13
-
14
-
15
-
16
-
17
-
18
-
19
-
20
-
21
-
22
-
23
-
24
-
25
-
26
-
27
-
28
-
29
-
30
-
31
-
32
-
33
-
 34
34 -
 35
35 -
 36
36 -
 37
37 -
 38
38 -
 39
39 -
 40
40 -
 41
41 -
 42
42 -
 43
43 -
 44
44 -
 45
45 -
 46
46 -
 47
47 -
 48
48 -
 49
49 -
 50
50 -
 51
51 -
 52
52 -
 53
53 -
 54
54 -
55
-
56
-
57
-
58
-
59
-
60
-
61
-
62
-
63
-
64
-
65
-
66
-
67
-
68
-
69
-
70
-
71
-
72
-
73
-
74
-
75
-
76
-
77
-
78
-
79
-
80
-
81
-
82
-
83
-
84
-
85
-
86
-
87
-
88
-
89
-
90
-
91
-
92
-
93
-
94
-
95
-
96
-
97
-
98
-
99
-
100
-
101
-
102
-
103
-
104
-
105
-
106
-
107
-
108
-
109
-
110
-
111
-
112
-
113
-
114
-
115
-
116
-
117
-
118
-
119
-
120
-
121
-
122
-
123
-
124
-
125
-
126
-
127
-
128
-
129
-
130
-
131
-
132
-
133
-
134
-
135
-
136
-
137
-
138
-
139
-
140
-
141
-
142
-
143
-
144
-
145
-
146
-
147
-
148
-
149
-
150
-
151
-
152
-
153
-
154
-
155
-
156
-
157
-
158
-
159
-
160
-
161
-
162
-
163
-
164
-
165
-
166
-
167
-
168
-
169
-
170
-
171
-
172
-
173
-
174
-
175
-
176
-
177
-
178
-
179
-
180
-
181
-
182
-
183
-
184
-
185
-
186
-
187
-
188
 |
 |
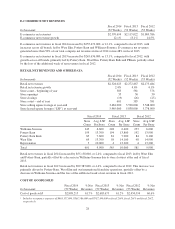
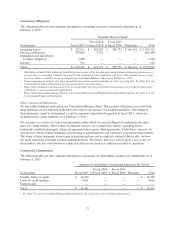
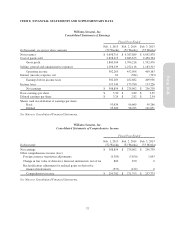
Fiscal 2014 vs. Fiscal 2013
Selling, general and administrative expenses for fiscal 2014 increased by $46,121,000, or 3.7%, compared to
fiscal 2013. Selling, general and administrative expenses as a percentage of net revenues decreased to 27.6% in
fiscal 2014 from 28.5% in fiscal 2013. This decrease as a percentage of net revenues was primarily driven by
greater advertising efficiency, lower general expenses, including litigation settlement income recorded of
$7,414,000, and the leverage of employment costs.
In the e-commerce channel, selling, general and administrative expenses as a percentage of net revenues
decreased in fiscal 2014 compared to fiscal 2013 primarily driven by greater advertising efficiency.
In the retail channel, selling, general and administrative expenses as a percentage of net revenues increased in
fiscal 2014 compared to fiscal 2013 primarily driven by employment cost deleverage, partially offset by lower
general expenses.
Fiscal 2013 vs. Fiscal 2012
Selling, general and administrative expenses for fiscal 2013 increased by $68,805,000, or 5.8%, compared to
fiscal 2012. Including employee separation charges of $2,932,000, selling, general and administrative expenses
as a percentage of net revenues decreased to 28.5% for fiscal 2013 from 29.3% for fiscal 2012 (which included
employee separation charges of $6,935,000 and asset impairment charges of $6,071,000). This decrease as a
percentage of net revenues was primarily driven by greater advertising efficiency due to increasing net revenues,
as well as a reduction in year-over-year asset impairment and employee separation charges.
In the e-commerce channel, selling, general and administrative expenses as a percentage of net revenues
decreased for fiscal 2013 compared to fiscal 2012 primarily driven by greater advertising efficiency due to
increasing net revenues.
In the retail channel, selling, general and administrative expenses as a percentage of net revenues decreased for
fiscal 2013 compared to fiscal 2012 primarily driven by a reduction in year-over-year asset impairment charges
and the leverage of employment costs due to increasing net revenues.
INCOME TAXES
Our effective income tax rate was 38.5% for fiscal 2014, 38.4% for fiscal 2013, and 37.4% for fiscal 2012. The
increase in the effective income tax rate in fiscal 2013 over fiscal 2012 was primarily driven by certain favorable
income tax resolutions and credits in fiscal 2012.
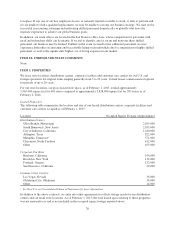
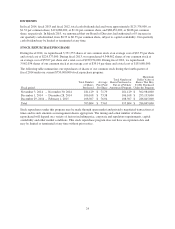
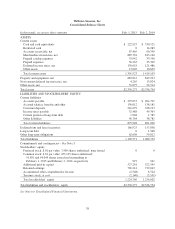
LIQUIDITY AND CAPITAL RESOURCES
As of February 1, 2015, we held $222,927,000 in cash and cash equivalents, the majority of which is held in
demand deposit accounts, of which $81,124,000 was held by our foreign subsidiaries. As is consistent within our
industry, our cash balances are seasonal in nature, with the fourth quarter historically representing a significantly
higher level of cash than other periods.
Throughout the fiscal year, we utilize our cash balances to build our inventory levels in preparation for our fourth
quarter holiday sales. In fiscal 2015, we plan to use our cash resources to fund our inventory and inventory
related purchases, advertising and marketing initiatives, stock repurchases, dividend payments and purchases of
property and equipment. In addition to our cash balances on hand, we have a $500,000,000 unsecured revolving
line of credit (“credit facility”) that may be used to borrow revolving loans or to request the issuance of letters of
credit. We may, upon notice to the administrative agent, request existing or new lenders to increase the credit
facility by up to $250,000,000, at such lenders’ option, to provide for a total of $750,000,000 of unsecured
revolving credit. During fiscal 2014, we had borrowings of $90,000,000 under the credit facility, all of which
were repaid in the fourth quarter of fiscal 2014. During fiscal 2013, we had no borrowings under the credit
facility.
During fiscal 2014, we redeemed restricted cash deposits of $14,289,000 previously held under collateralized
trust agreements. These deposits, which secured potential liabilities associated with our workers’ compensation
30