Pottery Barn 2014 Annual Report Download - page 52
Download and view the complete annual report
Please find page 52 of the 2014 Pottery Barn annual report below. You can navigate through the pages in the report by either clicking on the pages listed below, or by using the keyword search tool below to find specific information within the annual report.-
 1
1 -
2
-
3
-
4
-
5
-
6
-
7
-
8
-
9
-
10
-
11
-
12
-
13
-
14
-
15
-
16
-
17
-
18
-
19
-
20
-
21
-
22
-
23
-
24
-
25
-
26
-
27
-
28
-
29
-
30
-
31
-
32
-
33
-
34
-
35
-
36
-
37
-
38
-
39
-
40
-
41
-
 42
42 -
 43
43 -
 44
44 -
 45
45 -
 46
46 -
 47
47 -
 48
48 -
 49
49 -
 50
50 -
 51
51 -
 52
52 -
 53
53 -
 54
54 -
 55
55 -
 56
56 -
 57
57 -
 58
58 -
 59
59 -
 60
60 -
 61
61 -
 62
62 -
63
-
64
-
65
-
66
-
67
-
68
-
69
-
70
-
71
-
72
-
73
-
74
-
75
-
76
-
77
-
78
-
79
-
80
-
81
-
82
-
83
-
84
-
85
-
86
-
87
-
88
-
89
-
90
-
91
-
92
-
93
-
94
-
95
-
96
-
97
-
98
-
99
-
100
-
101
-
102
-
103
-
104
-
105
-
106
-
107
-
108
-
109
-
110
-
111
-
112
-
113
-
114
-
115
-
116
-
117
-
118
-
119
-
120
-
121
-
122
-
123
-
124
-
125
-
126
-
127
-
128
-
129
-
130
-
131
-
132
-
133
-
134
-
135
-
136
-
137
-
138
-
139
-
140
-
141
-
142
-
143
-
144
-
145
-
146
-
147
-
148
-
149
-
150
-
151
-
152
-
153
-
154
-
155
-
156
-
157
-
158
-
159
-
160
-
161
-
162
-
163
-
164
-
165
-
166
-
167
-
168
-
169
-
170
-
171
-
172
-
173
-
174
-
175
-
176
-
177
-
178
-
179
-
180
-
181
-
182
-
183
-
184
-
185
-
186
-
187
-
188
 |
 |

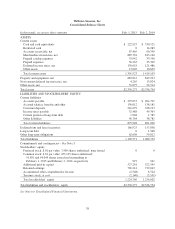
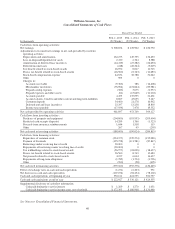
Williams-Sonoma, Inc.
Consolidated Balance Sheets
In thousands, except per share amounts Feb. 1, 2015 Feb. 2, 2014
ASSETS
Current assets
Cash and cash equivalents $ 222,927 $ 330,121
Restricted cash 0 14,289
Accounts receivable, net 67,465 60,330
Merchandise inventories, net 887,701 813,160
Prepaid catalog expenses 33,942 33,556
Prepaid expenses 36,265 35,309
Deferred income taxes, net 130,618 121,486
Other assets 13,005 10,852
Total current assets 1,391,923 1,419,103
Property and equipment, net 883,012 849,293
Non-current deferred income taxes, net 4,265 13,824
Other assets, net 51,077 54,514
Total assets $2,330,277 $2,336,734
LIABILITIES AND STOCKHOLDERS’ EQUITY
Current liabilities
Accounts payable $ 397,037 $ 404,791
Accrued salaries, benefits and other 136,012 138,181
Customer deposits 261,679 228,193
Income taxes payable 32,488 49,365
Current portion of long-term debt 1,968 1,785
Other liabilities 46,764 38,781
Total current liabilities 875,948 861,096
Deferred rent and lease incentives 166,925 157,856
Long-term debt 0 1,968
Other long-term obligations 62,698 59,812
Total liabilities 1,105,571 1,080,732
Commitments and contingencies – See Note J
Stockholders’ equity
Preferred stock: $.01 par value; 7,500 shares authorized; none issued 0 0
Common stock: $.01 par value; 253,125 shares authorized;
91,891 and 94,049 shares issued and outstanding at
February 1, 2015 and February 2, 2014, respectively 919 941
Additional paid-in capital 527,261 522,595
Retained earnings 701,214 729,043
Accumulated other comprehensive income (2,548) 6,524
Treasury stock, at cost (2,140) (3,101)
Total stockholders’ equity 1,224,706 1,256,002
Total liabilities and stockholders’ equity $2,330,277 $2,336,734
See Notes to Consolidated Financial Statements.
38