Pottery Barn 2014 Annual Report Download - page 43
Download and view the complete annual report
Please find page 43 of the 2014 Pottery Barn annual report below. You can navigate through the pages in the report by either clicking on the pages listed below, or by using the keyword search tool below to find specific information within the annual report.-
 1
1 -
2
-
3
-
4
-
5
-
6
-
7
-
8
-
9
-
10
-
11
-
12
-
13
-
14
-
15
-
16
-
17
-
18
-
19
-
20
-
21
-
22
-
23
-
24
-
25
-
26
-
27
-
28
-
29
-
30
-
31
-
32
-
 33
33 -
 34
34 -
 35
35 -
 36
36 -
 37
37 -
 38
38 -
 39
39 -
 40
40 -
 41
41 -
 42
42 -
 43
43 -
 44
44 -
 45
45 -
 46
46 -
 47
47 -
 48
48 -
 49
49 -
 50
50 -
 51
51 -
 52
52 -
 53
53 -
54
-
55
-
56
-
57
-
58
-
59
-
60
-
61
-
62
-
63
-
64
-
65
-
66
-
67
-
68
-
69
-
70
-
71
-
72
-
73
-
74
-
75
-
76
-
77
-
78
-
79
-
80
-
81
-
82
-
83
-
84
-
85
-
86
-
87
-
88
-
89
-
90
-
91
-
92
-
93
-
94
-
95
-
96
-
97
-
98
-
99
-
100
-
101
-
102
-
103
-
104
-
105
-
106
-
107
-
108
-
109
-
110
-
111
-
112
-
113
-
114
-
115
-
116
-
117
-
118
-
119
-
120
-
121
-
122
-
123
-
124
-
125
-
126
-
127
-
128
-
129
-
130
-
131
-
132
-
133
-
134
-
135
-
136
-
137
-
138
-
139
-
140
-
141
-
142
-
143
-
144
-
145
-
146
-
147
-
148
-
149
-
150
-
151
-
152
-
153
-
154
-
155
-
156
-
157
-
158
-
159
-
160
-
161
-
162
-
163
-
164
-
165
-
166
-
167
-
168
-
169
-
170
-
171
-
172
-
173
-
174
-
175
-
176
-
177
-
178
-
179
-
180
-
181
-
182
-
183
-
184
-
185
-
186
-
187
-
188
 |
 |

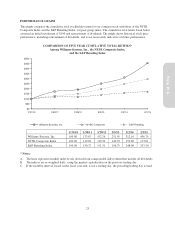
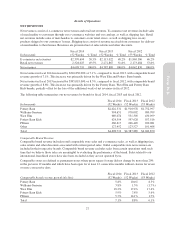
Cost of goods sold includes cost of goods, occupancy expenses and shipping costs. Cost of goods consists of cost
of merchandise, inbound freight expenses, freight-to-store expenses and other inventory related costs such as
shrinkage, damages and replacements. Occupancy expenses consist of rent, depreciation and other occupancy
costs, including common area maintenance, property taxes and utilities. Shipping costs consist of third party
delivery services and shipping materials.
Our classification of expenses in cost of goods sold may not be comparable to other public companies, as we do
not include non-occupancy related costs associated with our distribution network in cost of goods sold. These
costs, which include distribution network employment, third party warehouse management and other distribution
related administrative expenses, are recorded in selling, general and administrative expenses.
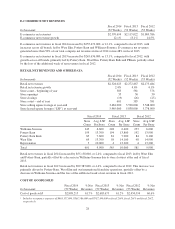
Within our reportable segments, the e-commerce channel does not incur freight-to-store or store occupancy
expenses, and typically operates with lower markdowns and inventory shrinkage than the retail channel.
However, the e-commerce channel incurs higher customer shipping, damage and replacement costs than the retail
channel.
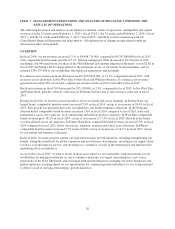
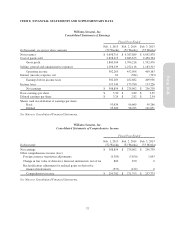
Fiscal 2014 vs. Fiscal 2013
Cost of goods sold increased by $214,542,000, or 8.0%, in fiscal 2014 compared to fiscal 2013. Cost of goods
sold as a percentage of net revenues increased to 61.7% in fiscal 2014 from 61.2% in fiscal 2013. This increase
was primarily driven by lower selling margins.
In the e-commerce channel, cost of goods sold as a percentage of net revenues increased in fiscal 2014 compared
to fiscal 2013 primarily driven by lower selling margins and an increase in occupancy expenses.
In the retail channel, cost of goods sold as a percentage of net revenues remained relatively flat in fiscal 2014
compared to fiscal 2013 due to an increase in occupancy expenses offset by higher selling margins.
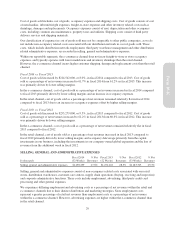
Fiscal 2013 vs. Fiscal 2012
Cost of goods sold increased by $233,279,000, or 9.5%, in fiscal 2013 compared to fiscal 2012. Cost of goods
sold as a percentage of net revenues increased to 61.2% in fiscal 2013 from 60.6% in fiscal 2012. This increase
was primarily driven by lower selling margins.
In the e-commerce channel, cost of goods sold as a percentage of net revenues remained relatively flat in fiscal
2013 compared to fiscal 2012.
In the retail channel, cost of goods sold as a percentage of net revenues increased in fiscal 2013 compared to
fiscal 2012 primarily driven by lower selling margins and occupancy deleverage primarily from the capital
investments in our business, including the investments in our company-owned global expansion and the loss of
revenues from the additional week in fiscal 2012.
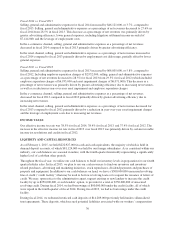
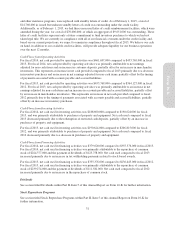
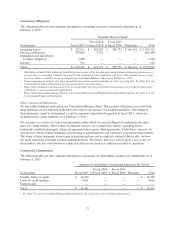
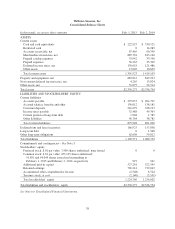
SELLING, GENERAL AND ADMINISTRATIVE EXPENSES
In thousands
Fiscal 2014
(52 Weeks)
% Net
Revenues
Fiscal 2013
(52 Weeks)
% Net
Revenues
Fiscal 2012
(53 Weeks)
% Net
Revenues
Selling, general and administrative expenses $1,298,239 27.6% $1,252,118 28.5% $1,183,313 29.3%
Selling, general and administrative expenses consist of non-occupancy related costs associated with our retail
stores, distribution warehouses, customer care centers, supply chain operations (buying, receiving and inspection)
and corporate administrative functions. These costs include employment, advertising, third party credit card
processing and other general expenses.
We experience differing employment and advertising costs as a percentage of net revenues within the retail and
e-commerce channels due to their distinct distribution and marketing strategies. Store employment costs
represent a greater percentage of retail net revenues than employment costs as a percentage of net revenues
within the e-commerce channel. However, advertising expenses are higher within the e-commerce channel than
in the retail channel.
29
Form 10-K