Pottery Barn 2014 Annual Report Download - page 54
Download and view the complete annual report
Please find page 54 of the 2014 Pottery Barn annual report below. You can navigate through the pages in the report by either clicking on the pages listed below, or by using the keyword search tool below to find specific information within the annual report.-
 1
1 -
2
-
3
-
4
-
5
-
6
-
7
-
8
-
9
-
10
-
11
-
12
-
13
-
14
-
15
-
16
-
17
-
18
-
19
-
20
-
21
-
22
-
23
-
24
-
25
-
26
-
27
-
28
-
29
-
30
-
31
-
32
-
33
-
34
-
35
-
36
-
37
-
38
-
39
-
40
-
41
-
42
-
43
-
 44
44 -
 45
45 -
 46
46 -
 47
47 -
 48
48 -
 49
49 -
 50
50 -
 51
51 -
 52
52 -
 53
53 -
 54
54 -
 55
55 -
 56
56 -
 57
57 -
 58
58 -
 59
59 -
 60
60 -
 61
61 -
 62
62 -
 63
63 -
 64
64 -
65
-
66
-
67
-
68
-
69
-
70
-
71
-
72
-
73
-
74
-
75
-
76
-
77
-
78
-
79
-
80
-
81
-
82
-
83
-
84
-
85
-
86
-
87
-
88
-
89
-
90
-
91
-
92
-
93
-
94
-
95
-
96
-
97
-
98
-
99
-
100
-
101
-
102
-
103
-
104
-
105
-
106
-
107
-
108
-
109
-
110
-
111
-
112
-
113
-
114
-
115
-
116
-
117
-
118
-
119
-
120
-
121
-
122
-
123
-
124
-
125
-
126
-
127
-
128
-
129
-
130
-
131
-
132
-
133
-
134
-
135
-
136
-
137
-
138
-
139
-
140
-
141
-
142
-
143
-
144
-
145
-
146
-
147
-
148
-
149
-
150
-
151
-
152
-
153
-
154
-
155
-
156
-
157
-
158
-
159
-
160
-
161
-
162
-
163
-
164
-
165
-
166
-
167
-
168
-
169
-
170
-
171
-
172
-
173
-
174
-
175
-
176
-
177
-
178
-
179
-
180
-
181
-
182
-
183
-
184
-
185
-
186
-
187
-
188
 |
 |

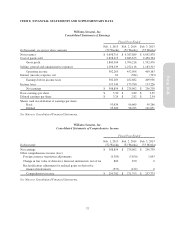
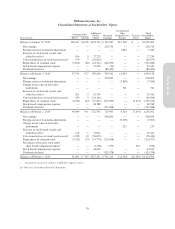
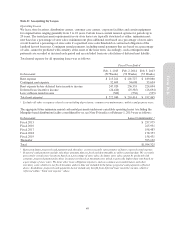
Williams-Sonoma, Inc.
Consolidated Statements of Cash Flows
Fiscal Year Ended
In thousands
Feb. 1, 2015
(52 Weeks)
Feb. 2, 2014
(52 Weeks)
Feb. 3, 2013
(53 Weeks)
Cash flows from operating activities:
Net earnings $ 308,854 $ 278,902 $ 256,730
Adjustments to reconcile net earnings to net cash provided by (used in)
operating activities:
Depreciation and amortization 162,273 149,795 134,453
Loss on disposal/impairment of assets 2,410 2,764 8,388
Amortization of deferred lease incentives (24,419) (25,382) (26,694)
Deferred income taxes (248) (28,344) (9,029)
Tax benefit related to stock-based awards 26,952 8,817 12,725
Excess tax benefit related to stock-based awards (26,560) (8,743) (12,683)
Stock-based compensation expense 44,632 38,788 31,042
Other 59500
Changes in:
Accounts receivable (9,366) 786 (16,408)
Merchandise inventories (76,964) (174,664) (85,981)
Prepaid catalog expenses (386) 3,675 (2,937)
Prepaid expenses and other assets (61) (13,649) (12,204)
Accounts payable 4,455 135,095 22,461
Accrued salaries, benefits and other current and long-term liabilities 8,867 43,635 9,147
Customer deposits 34,400 21,578 16,962
Deferred rent and lease incentives 23,297 13,238 18,803
Income taxes payable (17,034) 7,478 19,352
Net cash provided by operating activities 461,697 453,769 364,127
Cash flows from investing activities:
Purchases of property and equipment (204,800) (193,953) (205,404)
Restricted cash receipts (deposits) 14,289 1,766 (1,323)
Proceeds from insurance reimbursements 1,644 1,518 115
Other 267 45 (203)
Net cash used in investing activities (188,600) (190,624) (206,815)
Cash flows from financing activities:
Repurchase of common stock (224,377) (239,274) (155,080)
Payment of dividends (125,758) (111,581) (87,847)
Borrowings under revolving line of credit 90,000 0 0
Repayments of borrowings under revolving line of credit (90,000) 0 0
Tax withholdings related to stock-based awards (56,977) (18,096) (18,637)
Excess tax benefit related to stock-based awards 26,560 8,743 12,683
Net proceeds related to stock-based awards 4,077 6,614 14,637
Repayments of long-term obligations (1,785) (1,724) (1,796)
Other (760) (58) (405)
Net cash used in financing activities (379,020) (355,376) (236,445)
Effect of exchange rates on cash and cash equivalents (1,271) (2,203) 931
Net decrease in cash and cash equivalents (107,194) (94,434) (78,202)
Cash and cash equivalents at beginning of year 330,121 424,555 502,757
Cash and cash equivalents at end of year $ 222,927 $ 330,121 $ 424,555
Supplemental disclosure of cash flow information:
Cash paid during the year for interest $ 1,269 $ 1,270 $ 1,651
Cash paid during the year for income taxes, net of refunds $ 172,305 $ 186,968 $ 131,440
See Notes to Consolidated Financial Statements.
40