Pottery Barn 2014 Annual Report Download - page 138
Download and view the complete annual report
Please find page 138 of the 2014 Pottery Barn annual report below. You can navigate through the pages in the report by either clicking on the pages listed below, or by using the keyword search tool below to find specific information within the annual report.-
 1
1 -
2
-
3
-
4
-
5
-
6
-
7
-
8
-
9
-
10
-
11
-
12
-
13
-
14
-
15
-
16
-
17
-
18
-
19
-
20
-
21
-
22
-
23
-
24
-
25
-
26
-
27
-
28
-
29
-
30
-
31
-
32
-
33
-
34
-
35
-
36
-
37
-
38
-
39
-
40
-
41
-
42
-
43
-
44
-
45
-
46
-
47
-
48
-
49
-
50
-
51
-
52
-
53
-
54
-
55
-
56
-
57
-
58
-
59
-
60
-
61
-
62
-
63
-
64
-
65
-
66
-
67
-
68
-
69
-
70
-
71
-
72
-
73
-
74
-
75
-
76
-
77
-
78
-
79
-
80
-
81
-
82
-
83
-
84
-
85
-
86
-
87
-
88
-
89
-
90
-
91
-
92
-
93
-
94
-
95
-
96
-
97
-
98
-
99
-
100
-
101
-
102
-
103
-
104
-
105
-
106
-
107
-
108
-
109
-
110
-
111
-
112
-
113
-
114
-
115
-
116
-
117
-
118
-
119
-
120
-
121
-
122
-
123
-
124
-
125
-
126
-
127
-
 128
128 -
 129
129 -
 130
130 -
 131
131 -
 132
132 -
 133
133 -
 134
134 -
 135
135 -
 136
136 -
 137
137 -
 138
138 -
 139
139 -
 140
140 -
 141
141 -
 142
142 -
 143
143 -
 144
144 -
 145
145 -
 146
146 -
 147
147 -
 148
148 -
149
-
150
-
151
-
152
-
153
-
154
-
155
-
156
-
157
-
158
-
159
-
160
-
161
-
162
-
163
-
164
-
165
-
166
-
167
-
168
-
169
-
170
-
171
-
172
-
173
-
174
-
175
-
176
-
177
-
178
-
179
-
180
-
181
-
182
-
183
-
184
-
185
-
186
-
187
-
188
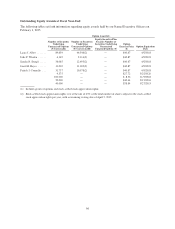
 |
 |

1. Company Classification in the Global Industry Classification Standard in one of the following:
• Home Furnishing Retail;
• Apparel Retail; or
• Department Stores;
2. Revenues between $1.8 billion and $7.3 billion;
3. Market capitalization greater than $800 million and less than $20 billion;
4. Between 14,000 and 56,000 employees; and/or
5. Among the top 100 e-retailers or an operator of multiple brands.
Our Fiscal 2014 Proxy Peer Group
For fiscal 2014, our proxy peer group consisted of the following 15 public companies:
Abercrombie & Fitch Co. lululemon athletica inc.
American Eagle Outfitters, Inc. Nordstrom, Inc.
Ann Inc. Pier 1 Imports, Inc.
Bed Bath & Beyond Inc. Restoration Hardware Holdings, Inc.
Coach, Inc. Ross Stores, Inc.
Foot Locker, Inc. Tiffany & Co.
The Gap, Inc. Urban Outfitters, Inc.
L Brands, Inc.
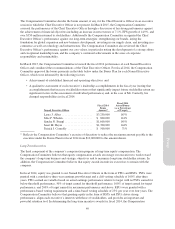
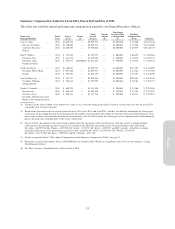
The following table provided by Cook & Co., based on publicly available information as of March 30, 2015,
provides a financial overview of the proxy peer group companies in order to compare their revenues, net income,
and market capitalization as a group relative to the company.
Annual
Net Revenue
(in millions)
Annual
Net Income
(in millions)
Market Capitalization
(in millions)
(as of 2/1/2015)
75th Percentile ........................................ $11,248 $822 $14,187
Average ............................................. $ 6,564 $489 $ 9,596
Median .............................................. $ 4,250 $484 $ 9,427
25th Percentile ........................................ $ 2,908 $ 88 $ 3,097
Williams-Sonoma, Inc. ................................. $ 4,699 $309 $ 7,216
Changes to Our Proxy Peer Group for Fiscal 2015
For fiscal 2015, the Compensation Committee updated the proxy peer group guiding criteria to reflect WSI’s
current revenues and market capitalization. In addition, the Compensation Committee considered compensation
peer companies used by proxy advisory firms, other major e-retailers, and other major retailers with sustained
positive total stockholder return. Upon completion of its review, the Compensation Committee made no changes
to the proxy peer group for fiscal 2015.
46