Pottery Barn 2014 Annual Report Download - page 42
Download and view the complete annual report
Please find page 42 of the 2014 Pottery Barn annual report below. You can navigate through the pages in the report by either clicking on the pages listed below, or by using the keyword search tool below to find specific information within the annual report.-
 1
1 -
2
-
3
-
4
-
5
-
6
-
7
-
8
-
9
-
10
-
11
-
12
-
13
-
14
-
15
-
16
-
17
-
18
-
19
-
20
-
21
-
22
-
23
-
24
-
25
-
26
-
27
-
28
-
29
-
30
-
31
-
 32
32 -
 33
33 -
 34
34 -
 35
35 -
 36
36 -
 37
37 -
 38
38 -
 39
39 -
 40
40 -
 41
41 -
 42
42 -
 43
43 -
 44
44 -
 45
45 -
 46
46 -
 47
47 -
 48
48 -
 49
49 -
 50
50 -
 51
51 -
 52
52 -
53
-
54
-
55
-
56
-
57
-
58
-
59
-
60
-
61
-
62
-
63
-
64
-
65
-
66
-
67
-
68
-
69
-
70
-
71
-
72
-
73
-
74
-
75
-
76
-
77
-
78
-
79
-
80
-
81
-
82
-
83
-
84
-
85
-
86
-
87
-
88
-
89
-
90
-
91
-
92
-
93
-
94
-
95
-
96
-
97
-
98
-
99
-
100
-
101
-
102
-
103
-
104
-
105
-
106
-
107
-
108
-
109
-
110
-
111
-
112
-
113
-
114
-
115
-
116
-
117
-
118
-
119
-
120
-
121
-
122
-
123
-
124
-
125
-
126
-
127
-
128
-
129
-
130
-
131
-
132
-
133
-
134
-
135
-
136
-
137
-
138
-
139
-
140
-
141
-
142
-
143
-
144
-
145
-
146
-
147
-
148
-
149
-
150
-
151
-
152
-
153
-
154
-
155
-
156
-
157
-
158
-
159
-
160
-
161
-
162
-
163
-
164
-
165
-
166
-
167
-
168
-
169
-
170
-
171
-
172
-
173
-
174
-
175
-
176
-
177
-
178
-
179
-
180
-
181
-
182
-
183
-
184
-
185
-
186
-
187
-
188
 |
 |

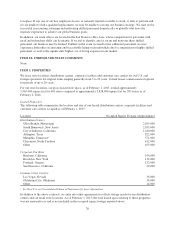
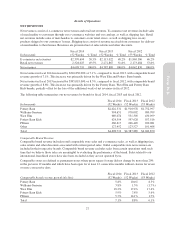
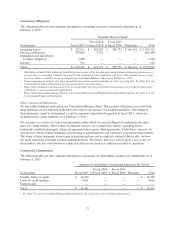
E-COMMERCE NET REVENUES
In thousands
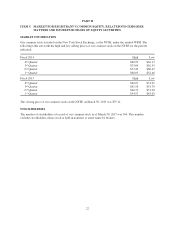
Fiscal 2014
(52 Weeks)
Fiscal 2013
(52 Weeks)
Fiscal 2012
(53 Weeks)
E-commerce net revenues $2,370,694 $2,115,022 $1,869,386
E-commerce net revenue growth 12.1% 13.1% 14.5%
E-commerce net revenues in fiscal 2014 increased by $255,672,000, or 12.1%, compared to fiscal 2013, with
increases across all brands, led by West Elm, Pottery Barn and Williams-Sonoma. E-commerce net revenues
generated more than 50% of our total company net revenues in fiscal 2014 versus 48% in fiscal 2013.
E-commerce net revenues in fiscal 2013 increased by $245,636,000, or 13.1%, compared to fiscal 2012, with
growth across all brands, primarily led by Pottery Barn, West Elm, Pottery Barn Kids and PBteen, partially offset
by the loss of the additional week of net revenues in fiscal 2012.
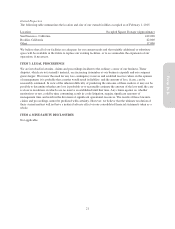
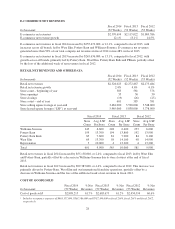
RETAIL NET REVENUES AND OTHER DATA
In thousands
Fiscal 2014
(52 Weeks)
Fiscal 2013
(52 Weeks)
Fiscal 2012
(53 Weeks)
Retail net revenues $2,328,025 $2,272,867 $2,173,484
Retail net revenue growth 2.4% 4.6% 4.1%
Store count – beginning of year 585 581 576
Store openings 35 30 30
Store closings (19) (26) (25)
Store count – end of year 601 585 581
Store selling square footage at year-end 3,684,000 3,590,000 3,548,000
Store leased square footage (“LSF”) at year-end 5,965,000 5,838,000 5,778,000
Fiscal 2014 Fiscal 2013 Fiscal 2012
Store
Count
Avg. LSF
Per Store
Store
Count
Avg. LSF
Per Store
Store
Count
Avg. LSF
Per Store
Williams-Sonoma 243 6,600 248 6,600 253 6,600
Pottery Barn 199 13,700 194 13,800 192 13,900
Pottery Barn Kids 85 7,600 81 7,900 84 8,100
West Elm 69 13,700 58 14,100 48 14,900
Rejuvenation 5 10,000 4 13,200 4 13,200
Total 601 9,900 585 10,000 581 9,900
Retail net revenues in fiscal 2014 increased by $55,158,000, or 2.4%, compared to fiscal 2013, led by West Elm
and Pottery Barn, partially offset by a decrease in Williams-Sonoma due to store closures at the end of fiscal
2013.
Retail net revenues in fiscal 2013 increased by $99,383,000, or 4.6%, compared to fiscal 2012. This increase was
primarily driven by Pottery Barn, West Elm and our international franchise operations, partially offset by a
decrease in Williams-Sonoma and the loss of the additional week of net revenues in fiscal 2012.
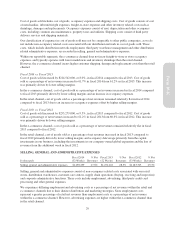
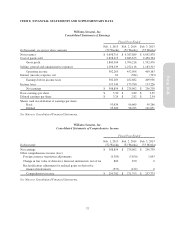
COST OF GOODS SOLD
In thousands
Fiscal 2014
(52 Weeks)
% Net
Revenues
Fiscal 2013
(52 Weeks)
% Net
Revenues
Fiscal 2012
(53 Weeks)
% Net
Revenues
Cost of goods sold1$2,898,215 61.7% $2,683,673 61.2% $2,450,394 60.6%
1Includes occupancy expenses of $603,357,000, $561,586,000 and $517,300,000 in fiscal 2014, fiscal 2013 and fiscal 2012,
respectively.
28