Pottery Barn 2014 Annual Report Download - page 39
Download and view the complete annual report
Please find page 39 of the 2014 Pottery Barn annual report below. You can navigate through the pages in the report by either clicking on the pages listed below, or by using the keyword search tool below to find specific information within the annual report.-
 1
1 -
2
-
3
-
4
-
5
-
6
-
7
-
8
-
9
-
10
-
11
-
12
-
13
-
14
-
15
-
16
-
17
-
18
-
19
-
20
-
21
-
22
-
23
-
24
-
25
-
26
-
27
-
28
-
 29
29 -
 30
30 -
 31
31 -
 32
32 -
 33
33 -
 34
34 -
 35
35 -
 36
36 -
 37
37 -
 38
38 -
 39
39 -
 40
40 -
 41
41 -
 42
42 -
 43
43 -
 44
44 -
 45
45 -
 46
46 -
 47
47 -
 48
48 -
 49
49 -
50
-
51
-
52
-
53
-
54
-
55
-
56
-
57
-
58
-
59
-
60
-
61
-
62
-
63
-
64
-
65
-
66
-
67
-
68
-
69
-
70
-
71
-
72
-
73
-
74
-
75
-
76
-
77
-
78
-
79
-
80
-
81
-
82
-
83
-
84
-
85
-
86
-
87
-
88
-
89
-
90
-
91
-
92
-
93
-
94
-
95
-
96
-
97
-
98
-
99
-
100
-
101
-
102
-
103
-
104
-
105
-
106
-
107
-
108
-
109
-
110
-
111
-
112
-
113
-
114
-
115
-
116
-
117
-
118
-
119
-
120
-
121
-
122
-
123
-
124
-
125
-
126
-
127
-
128
-
129
-
130
-
131
-
132
-
133
-
134
-
135
-
136
-
137
-
138
-
139
-
140
-
141
-
142
-
143
-
144
-
145
-
146
-
147
-
148
-
149
-
150
-
151
-
152
-
153
-
154
-
155
-
156
-
157
-
158
-
159
-
160
-
161
-
162
-
163
-
164
-
165
-
166
-
167
-
168
-
169
-
170
-
171
-
172
-
173
-
174
-
175
-
176
-
177
-
178
-
179
-
180
-
181
-
182
-
183
-
184
-
185
-
186
-
187
-
188
 |
 |

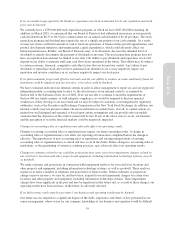
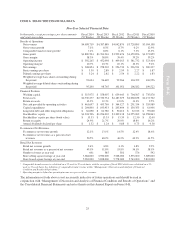
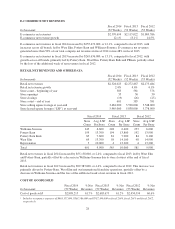
ITEM 6. SELECTED FINANCIAL DATA
Five-Year Selected Financial Data
In thousands, except percentages, per share amounts
and retail stores data
Fiscal 2014
(52 Weeks)
Fiscal 2013
(52 Weeks)
Fiscal 2012
(53 Weeks)
Fiscal 2011
(52 Weeks)
Fiscal 2010
(52 Weeks)
Results of Operations
Net revenues $4,698,719 $4,387,889 $4,042,870 $3,720,895 $3,504,158
Net revenue growth 7.1% 8.5% 8.7% 6.2% 12.9%
Comparable brand revenue growth17.1% 8.8% 6.1% 7.3% 13.9%
Gross profit $1,800,504 $1,704,216 $1,592,476 $1,459,856 $1,373,859
Gross margin 38.3% 38.8% 39.4% 39.2% 39.2%
Operating income $ 502,265 $ 452,098 $ 409,163 $ 381,732 $ 323,414
Operating margin210.7% 10.3% 10.1% 10.3% 9.2%
Net earnings $ 308,854 $ 278,902 $ 256,730 $ 236,931 $ 200,227
Basic earnings per share $ 3.30 $ 2.89 $ 2.59 $ 2.27 $ 1.87
Diluted earnings per share $ 3.24 $ 2.82 $ 2.54 $ 2.22 $ 1.83
Weighted average basic shares outstanding during
the period 93,634 96,669 99,266 104,352 106,956
Weighted average diluted shares outstanding during
the period 95,200 98,765 101,051 106,582 109,522
Financial Position
Working capital $ 515,975 $ 558,007 $ 659,645 $ 704,567 $ 735,878
Total assets $2,330,277 $2,336,734 $2,187,679 $2,060,838 $2,131,762
Return on assets 13.2% 12.3% 12.0% 11.3% 9.5%
Net cash provided by operating activities $ 461,697 $ 453,769 $ 364,127 $ 291,334 $ 355,989
Capital expenditures $ 204,800 $ 193,953 $ 205,404 $ 130,353 $ 61,906
Long-term debt and other long-term obligations $ 62,698 $ 61,780 $ 50,216 $ 52,015 $ 59,048
Stockholders’ equity $1,224,706 $1,256,002 $1,309,138 $1,255,262 $1,258,863
Stockholders’ equity per share (book value) $ 13.33 $ 13.35 $ 13.39 $ 12.50 $ 12.00
Return on equity 24.9% 21.7% 20.0% 18.8% 16.2%
Annual dividends declared per share $ 1.32 $ 1.24 $ 0.88 $ 0.73 $ 0.58
E-commerce Net Revenues
E-commerce net revenue growth 12.1% 13.1% 14.5% 12.4% 18.6%
E-commerce net revenues as a percent of net
revenues 50.5% 48.2% 46.2% 43.9% 41.5%
Retail Net Revenues
Retail net revenue growth 2.4% 4.6% 4.1% 1.8% 9.2%
Retail net revenues as a percent of net revenues 49.5% 51.8% 53.8% 56.1% 58.5%
Number of stores at year-end 601 585 581 576 592
Store selling square footage at year-end 3,684,000 3,590,000 3,548,000 3,535,000 3,609,000
Store leased square footage at year-end 5,965,000 5,838,000 5,778,000 5,743,000 5,831,000
1Comparable brand revenue is calculated on a 52-week to 52-week basis, with the exception of fiscal 2012 which was calculated on a 53-
week to 53-week basis. See definition of comparable brand revenue within “Management’s Discussion and Analysis of Financial
Condition and Results of Operations.”
2Operating margin is defined as operating income as a percent of net revenues.
The information set forth above is not necessarily indicative of future operations and should be read in
conjunction with “Management’s Discussion and Analysis of Financial Condition and Results of Operations” and
the Consolidated Financial Statements and notes thereto in this Annual Report on Form 10-K.
25
Form 10-K