Pottery Barn 2005 Annual Report Download - page 71
Download and view the complete annual report
Please find page 71 of the 2005 Pottery Barn annual report below. You can navigate through the pages in the report by either clicking on the pages listed below, or by using the keyword search tool below to find specific information within the annual report.-
 1
1 -
2
-
3
-
4
-
5
-
6
-
7
-
8
-
9
-
10
-
11
-
12
-
13
-
14
-
15
-
16
-
17
-
18
-
19
-
20
-
21
-
22
-
23
-
24
-
25
-
26
-
27
-
28
-
29
-
30
-
31
-
32
-
33
-
34
-
35
-
36
-
37
-
38
-
39
-
40
-
41
-
42
-
43
-
44
-
45
-
46
-
47
-
48
-
49
-
50
-
51
-
52
-
53
-
54
-
55
-
56
-
57
-
58
-
59
-
60
-
 61
61 -
 62
62 -
 63
63 -
 64
64 -
 65
65 -
 66
66 -
 67
67 -
 68
68 -
 69
69 -
 70
70 -
 71
71 -
 72
72 -
 73
73 -
 74
74 -
 75
75 -
 76
76 -
 77
77 -
 78
78 -
 79
79 -
 80
80 -
 81
81 -
82
-
83
-
84
-
85
-
86
-
87
-
88
-
89
-
90
-
91
-
92
-
93
-
94
-
95
-
96
-
97
-
98
-
99
-
100
-
101
-
102
-
103
-
104
-
105
-
106
-
107
-
108
-
109
-
110
-
111
-
112
-
113
-
114
-
115
-
116
-
117
-
118
-
119
-
120
-
121
-
122
-
123
-
124
-
125
-
126
-
127
-
128
-
129
-
130
-
131
-
132
-
133
-
134
-
135
-
136
-
137
-
138
-
139
-
140
-
141
-
142
-
143
-
144
-
145
-
146
-
147
-
148
-
149
-
150
-
151
-
152
-
153
-
154
-
155
-
156
-
157
-
158
-
159
-
160
 |
 |

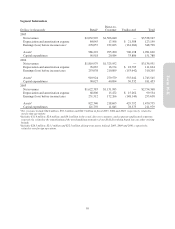
Segment Information
Dollars in thousands Retail1
Direct-to-
Customer Unallocated Total
2005
Net revenues $2,032,907 $1,506,040 — $3,538,947
Depreciation and amortization expense 84,045 17,566 $ 21,588 123,199
Earnings (loss) before income taxes2278,057 232,023 (161,282) 348,798
Assets3986,222 295,200 700,198 1,981,620
Capital expenditures 96,918 20,984 33,886 151,788
2004
Net revenues $1,810,979 $1,325,952 — $3,136,931
Depreciation and amortization expense 76,667 16,174 $ 18,783 111,624
Earnings (loss) before income taxes 253,038 210,809 (153,642) 310,205
Assets3910,924 279,579 555,042 1,745,545
Capital expenditures 90,027 40,894 50,532 181,453
2003
Net revenues $1,622,383 $1,131,985 — $2,754,368
Depreciation and amortization expense 68,800 15,472 $ 15,262 99,534
Earnings (loss) before income taxes 231,512 172,266 (148,140) 255,638
Assets3822,340 218,603 429,792 1,470,735
Capital expenditures 121,759 11,845 78,375 211,979
1Net revenues include $64.6 million, $50.1 million and $42.7 million in fiscal 2005, 2004 and 2003, respectively, related to
our foreign operations.
2Includes $11.4 million, $2.0 million, and $0.1 million in the retail, direct-to-customer, and corporate unallocated segments,
respectively, related to the transitioning of the merchandising strategies of our Hold Everything brand into our other existing
brands.
3Includes $26.5 million, $23.1 million and $22.5 million of long-term assets in fiscal 2005, 2004 and 2003, respectively,
related to our foreign operations.
59
Form 10-K